


Bitcoin Faces Familiar Crossroads As Midterm Cycle Turns Bearish: Analyst



A worst-case scenario is now on the table. Some analysts say Bitcoin could fall as low as $41,000 if a bear flag pattern currently forming on price charts plays out — a warning sign drawing attention as the cryptocurrency trades near $66,000, roughly half of what it was worth at its recent high.
Geopolitical Shock Hits At A Bad Time
The closure of the Strait of Hormuz sent oil prices surging this week, rattling global markets and pulling risk assets lower. Bitcoin was caught in the selloff.
Prices slipped below $66,000 as traders weighed rising energy costs, stubborn US inflation, and fresh stress in the bond market. The timing of the geopolitical flare-up has made an already fragile price setup harder to defend.
A bear flag pattern — a technical chart signal where prices briefly consolidate after a decline before continuing lower — is now visible on Bitcoin’s chart.
Based on reports from market analysts, the pattern puts an initial downside target near $50,000, with the $41,000 level emerging as a deeper floor if selling pressure intensifies.
Bitcoin is down 47% from its peak. That kind of drawdown might sound alarming, but analysts who track long-term crypto cycles say it fits a pattern that has shown up before.
A Cycle That Has Played Out Before
Data shows that Bitcoin tends to lose momentum in midterm years. Reports going back to 2014, 2018, and 2022 show a recurring sequence: prices start the year relatively stable, fade through late Q1 into early Q2, and then grind lower through the summer months. The 2026 price action has tracked this historical average closely.
On average, around now is when #Bitcoin continues its decline in midterm years. pic.twitter.com/JZ7Rcx2wJY
— Benjamin Cowen (@intocryptoverse) March 27, 2026
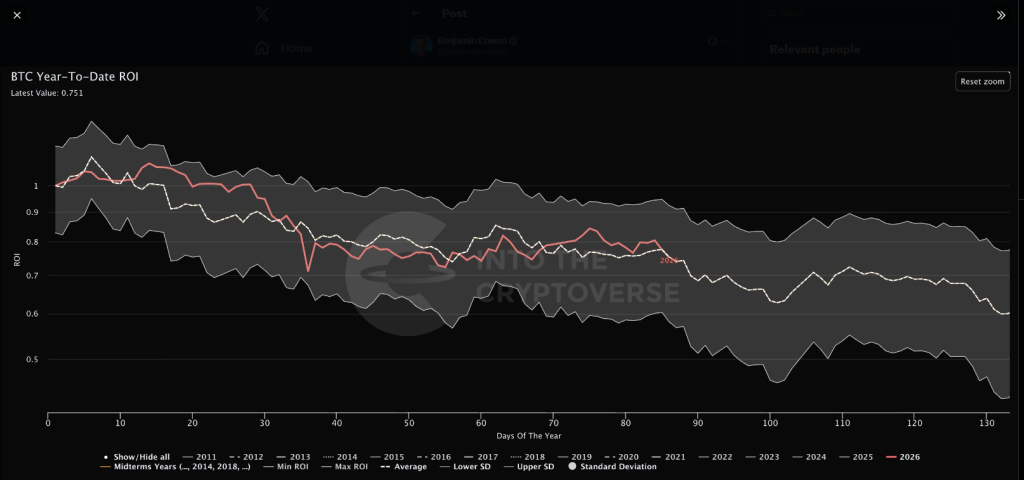
Analyst Benjamin Cowen, who has followed Bitcoin’s multi-year cycles, points to what he calls the mid-cycle dip zone — a phase that typically follows a major bull run and stretches across several quarters.
According to Cowen, midterm years are not crash events. They are cooldown periods. Rallies lose steam. Volatility picks up. Corrections run longer than most investors expect.
That description fits what is happening now. Following a strong run in 2025, Bitcoin’s year-to-date performance has tilted negative, matching the kind of softening seen in prior cycles.
Patience May Be The Only Strategy LeftFor long-term Bitcoin holders, the message from analysts is straightforward: this has happened before, and it has always eventually ended.
But the short-term picture offers little comfort. Macro pressures are stacking up at the same moment that Bitcoin’s chart structure is weakening, and there is no clear catalyst in sight to reverse the trend.
Featured image from Unsplash, chart from TradingView
Recommended Articles








Comments (0)
Click the $ button, enter the symbol, and select to link a stock, ETF, or other ticker.