


Ethereum Price Drops to $2,100, Shaking Confidence Amid Volatility



Ethereum price started a sharp decline from the $2,385 zone. ETH is now consolidating above $2,100 and might aim for a recovery wave if it climbs above $2,200.
- Ethereum started a sharp decline below the $2,320 zone.
- The price is trading below $2,250 and the 100-hourly Simple Moving Average.
- There was a break below a major bullish trend line with support at $2,160 on the hourly chart of ETH/USD (data feed via Kraken).
- The pair could continue to move up if it clears the $2,200 zone.
Ethereum Price Takes Hit
Ethereum price failed to stay above $2,320 and started a fresh decline, like Bitcoin. ETH price declined below $2,250 and $2,200 to enter a short-term bearish zone.
There was a break below a major bullish trend line with support at $2,160 on the hourly chart of ETH/USD. The pair even spiked below $2,120. A low was formed at $2,100, and the price is now consolidating losses below the 23.6% Fib retracement level of the recent decline from the $2,385 swing high to the $2,100 low.
Ethereum price is now trading below $2,200 and the 100-hourly Simple Moving Average. If the bulls remain in action above $2,100, the price could attempt another increase. Immediate resistance is seen near the $2,165 level.
The first key resistance is near the $2,200 level and the 100-hourly Simple Moving Average. The next major resistance is near the $2,240 level or the 50% Fib retracement level of the recent decline from the $2,385 swing high to the $2,100 low.
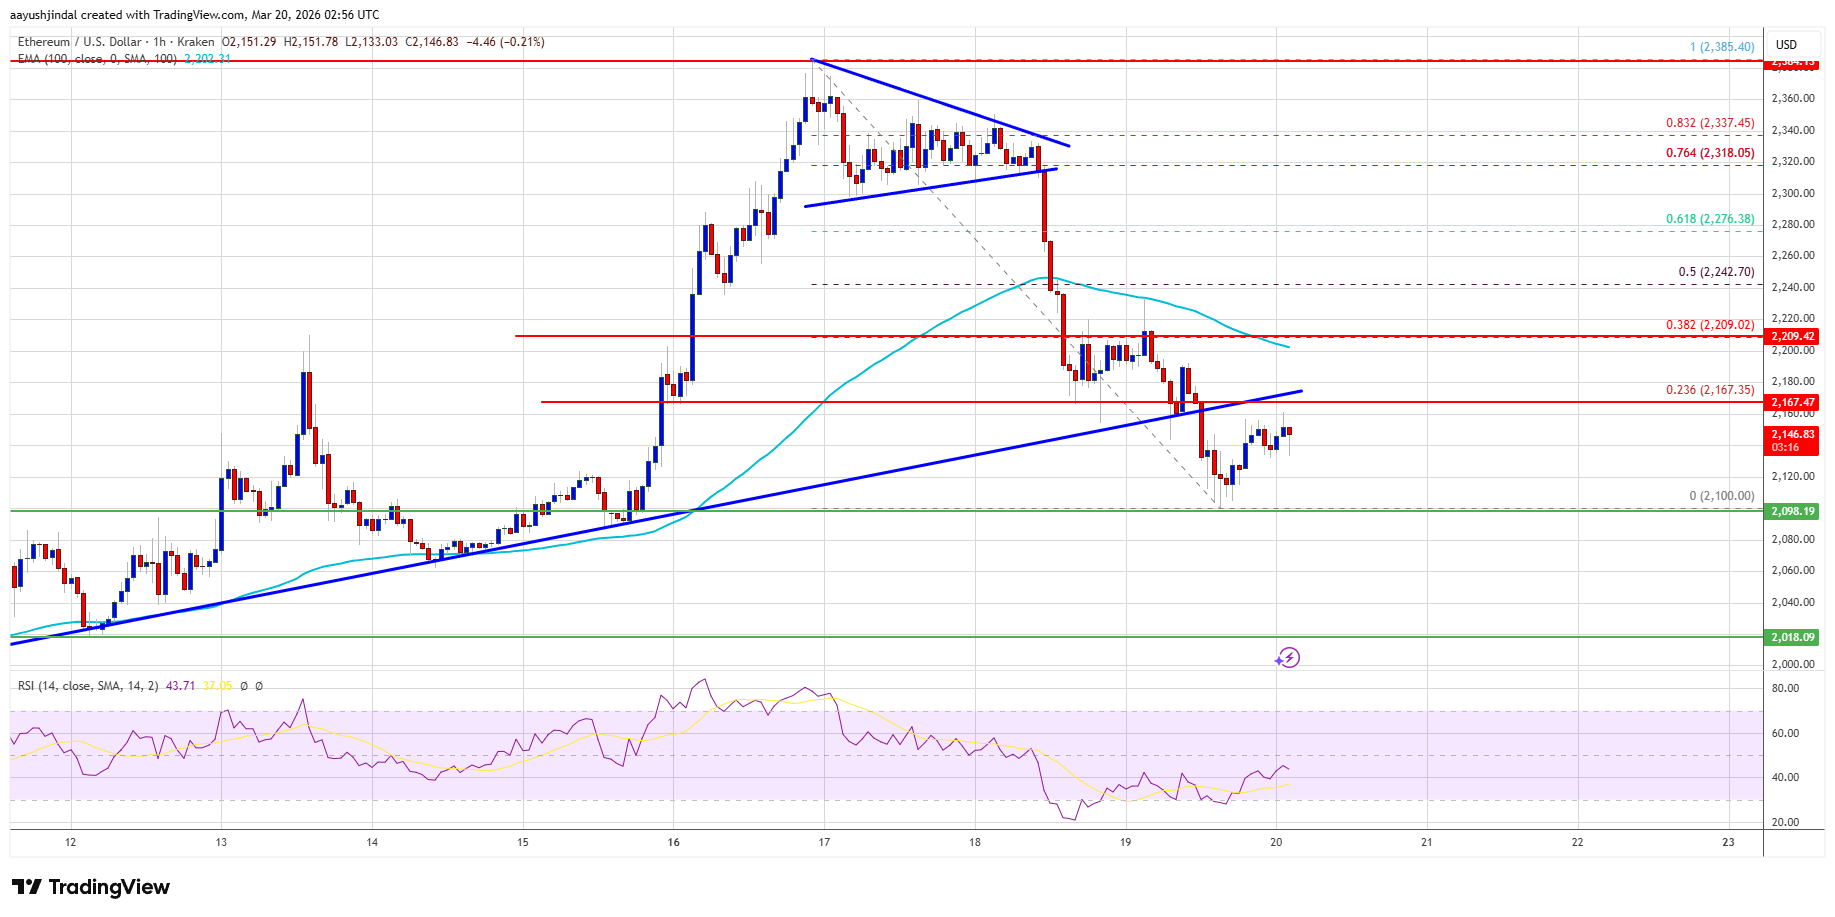
A clear move above the $2,240 resistance might send the price toward the $2,275 resistance. An upside break above the $2,275 region might call for more gains in the coming days. In the stated case, Ether could rise toward the $2,320 resistance zone or even $2,385 in the near term.
More Losses In ETH?
If Ethereum fails to clear the $2,200 resistance, it could start a fresh decline. Initial support on the downside is near the $2,120 level. The first major support sits near the $2,100 zone.
A clear move below the $2,100 support might push the price toward the $2,060 support. Any more losses might send the price toward the $2,020 region. The main support could be $2,000.
Technical Indicators
Hourly MACD – The MACD for ETH/USD is losing momentum in the bearish zone.
Hourly RSI – The RSI for ETH/USD is now below the 50 zone.
Major Support Level – $2,120
Major Resistance Level – $2,200
Recommended Articles







Comments (0)
Click the $ button, enter the symbol, and select to link a stock, ETF, or other ticker.