


Say What You Want — XRP’s Chart Is Screaming $50 — Analyst



XRP has had a rough few months. After touching a high of roughly $3.66 in mid-2025, the token has since pulled back sharply, recently hovering around $1.30. That is a steep drop by any measure.
But one widely followed crypto commentator is not backing down from a bold long-term call — and his argument rests entirely on what he sees in the charts.
A Chart That Points Higher, Way Higher
The analyst, known on X as CryptoBull, posted a monthly XRP/USD chart showing what he described as a multi-year consolidation pattern followed by a fresh breakout attempt heading into 2026.
His conclusion was blunt: a move to $50 looks like a “natural and normal” extension of the current structure. “No matter your feelings,” he wrote, “the chart says $50.”
Based on reports, CryptoBull has been building this case for some time, and the $50 figure is not pulled out of thin air — it falls squarely within the $28 to $70 target band he had previously laid out using higher timeframe analysis.
You can’t tell me that #XRP to $50 is not a very natural and normal looking chart. No matter your feelings, the chart says $50. pic.twitter.com/QHfBOPQ3hg
— CryptoBull (@CryptoBull2020) February 14, 2026
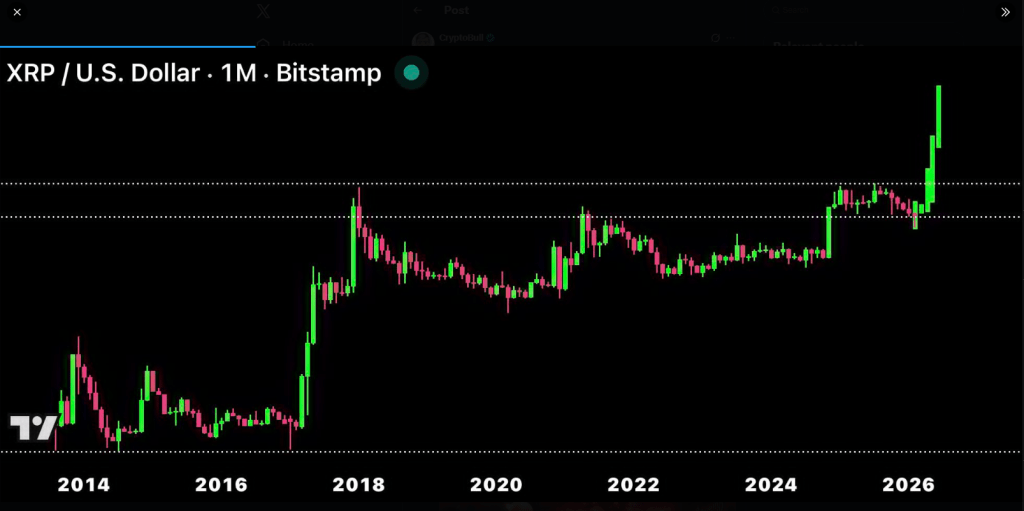
At current prices, a run to $50 would mean gains of more than 3,500%. That is a big number. But CryptoBull has been consistent in pushing back against the even wilder figures that circulate in XRP circles.
He has publicly rejected price targets of $1,000 or $10,000, calling them unsupported by any credible chart structure. By his own standards, $50 is the measured, reasonable call.
For context, a $28 XRP price would put its total market value near $1.7 trillion. At $70, that figure climbs above $4 trillion. Extreme? Yes. But far more grounded than the multi-hundred-trillion valuations implied by some of the more outlandish targets floating around online.
History As A Reference Point
CryptoBull has also pointed to XRP’s own track record to support his thesis. Reports say he reminded his followers that XRP once surged 3,500% — climbing from $0.11 all the way to $3.65 in a single market cycle.
Using that as a baseline, he suggested that a 2,000% expansion from current levels toward $28 is plausible in this cycle. A move to $50 would actually exceed that, coming in closer to the 3,500% range — roughly matching the scale of that earlier historic run.
$XRP‘s measured move target above $15 goes unchanged!
The breakout that took place in late 2024 hints at another 10X (>900% Increase) being possible to those price levels… pic.twitter.com/dbuZFcVCvj
— JAVON
MARKS (@JavonTM1) February 25, 2026
Other analysts have echoed a similarly constructive view. Javon Marks has maintained that his measured price target above $15 remains unchanged, citing the same late-2024 breakout structure that CryptoBull references.
Korean Elliott Wave analyst XForceGlobal has also weighed in, saying XRP’s chart looks strong after the token revisited its previous all-time high zone and fully retraced toward the $1 area — a reset he believes can come before a powerful upward move.
Featured image from Unsplash, chart from TradingView
Recommended Articles










Comments (0)
Click the $ button, enter the symbol, and select to link a stock, ETF, or other ticker.