


Dogecoin Is Now In The ‘Maximum Opportunity / Minimum Risk’ Zone: Crypto Analyst



Dogecoin is flashing what crypto analyst Cryptollica (@Cryptollica) calls on X a rare “maximum opportunity / minimum risk” setup, as long-horizon indicators on a DOGE-versus-dollar proxy chart push into levels that previously coincided with cycle lows.
Why This Could Be The ‘Maximum Opportunity’ For Dogecoin
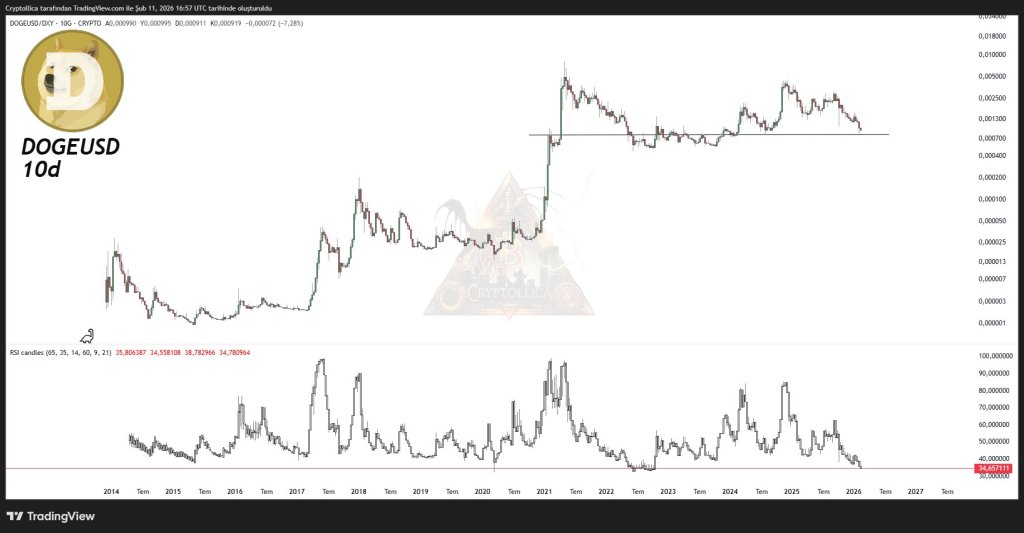
In a Feb. 11 post on X, Cryptollica shared a 10-day DOGE chart denominated against the US Dollar Index (DXY), arguing the slower timeframe “filters out the intraday noise and reveals the true cyclical nature of the asset.” The analyst framed the move as a reset back to a historically important base level and pointed to momentum readings that, in past cycles, marked capitulation.
At the center of Cryptollica’s thesis is a black horizontal line on the DOGE/DXY 10-day chart — a level the analyst described as the historic “Launchpad.”
“The black horizontal line represents the historic ‘Launchpad.’ In early 2021, this level was the breakout resistance that ignited the bull run (ELON),” Cryptollica wrote. “In 2022, 2023, and now 2026, this same level is acting as a macro support fortress. Price has returned to its origin.”
That framing leans on a classic market-structure idea: prior resistance that becomes support can act as a memory point for positioning and risk-taking, especially when the market revisits it after a full boom-bust loop.
Cryptollica also highlighted the 10-day RSI sitting at 34, referencing a “red line” zone on the indicator. The claim: when DOGE’s RSI reached that same zone in prior stress periods, including 2015, March 2020, and 2022, it preceded meaningful rebounds.
“Every time the RSI touched this zone (2015, March 2020 (covid crash), 2022), it marked a cyclical bottom followed by a significant rally,” Cryptollica wrote. “We are mathematically in the ‘Maximum Opportunity / Minimum Risk’ zone.”
The post stops short of calling for immediate upside, but the language suggests the analyst sees skew shifting: less perceived downside relative to the potential upside if a new expansion phase begins.
Is The Dogecoin Bottom In?
In a separate chart shared on Wednesday, Cryptollica mapped DOGE/USDT on a 3-day timeframe, sketching a wide channel with a labeled TopLine, Midline, and BottomLine. The chart annotates prior turning points around $0.75, $0.49, $0.22, and $0.09, with price now drifting back toward the lower boundary near the $0.07–$0.08 area. Cryptollica captioned the second image simply: “DOGE BOTTOM ?”

Taken together, the posts lay out a conditional thesis rather than a timed call: DOGE has rotated back to a historically important support reference on a macro-style pair (DOGE/DXY), while momentum sits in a zone that previously aligned with cycle inflection points. Whether that historical rhyme turns into a repeat will likely hinge on whether the “launchpad” support holds and whether DOGE can reclaim higher range levels marked on the longer timeframe channel rather than continuing to bleed along the bottom boundary.
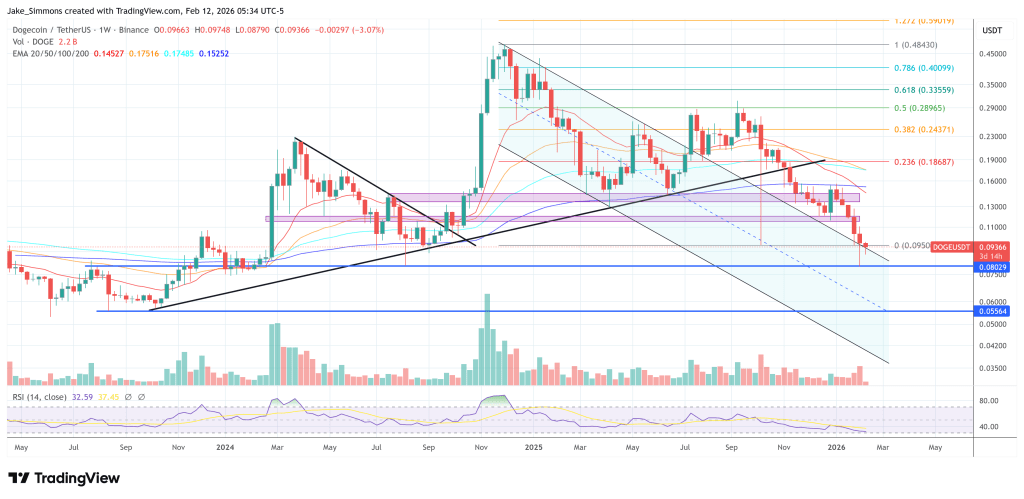
At press time, DOGE traded at $0.09366.
Recommended Articles








Comments (0)
Click the $ button, enter the symbol, and select to link a stock, ETF, or other ticker.