

Litecoin Price Forecast: LTC eyes $50 as heavy losses weigh on investors

- Litecoin investors booked nearly $40 million in losses over the weekend.
- Following a strong decline over the past few weeks, LTC investors are sitting on an average loss of 40%.
- LTC could test $45 again if it falls below $50.
Following a strong downtrend across the crypto market over the past week, Litecoin holders are under immense pressure. The Bitcoin fork has trimmed about $1.81 billion from its market capitalization since the beginning of the year, sending it below the top 20 cryptos by market cap.
The move comes as Litecoin's Network Realized Profit/Loss metric shows that investors have been steadily booking losses since December. Over the weekend, the network saw nearly $40 million in realized losses.
The move comes as the market value to realized value (MVRV) ratio, which measures the average profit/loss of all investors in a token, shows that Litecoin holders are seeing an average loss of about 40% on their holdings.
 [16-1770671428667-1770671428668.32.03, 09 Feb, 2026].png)
Historically, a notable recovery often follows when the MVRV is around such levels after sustained periods of loss realization. However, investors may begin another round of loss realization losses if wider market sentiment fails to improve.
On the derivatives side, Litecoin's open interest remains weak, declining further toward $350 million while its funding rates continue to show negative flashes.
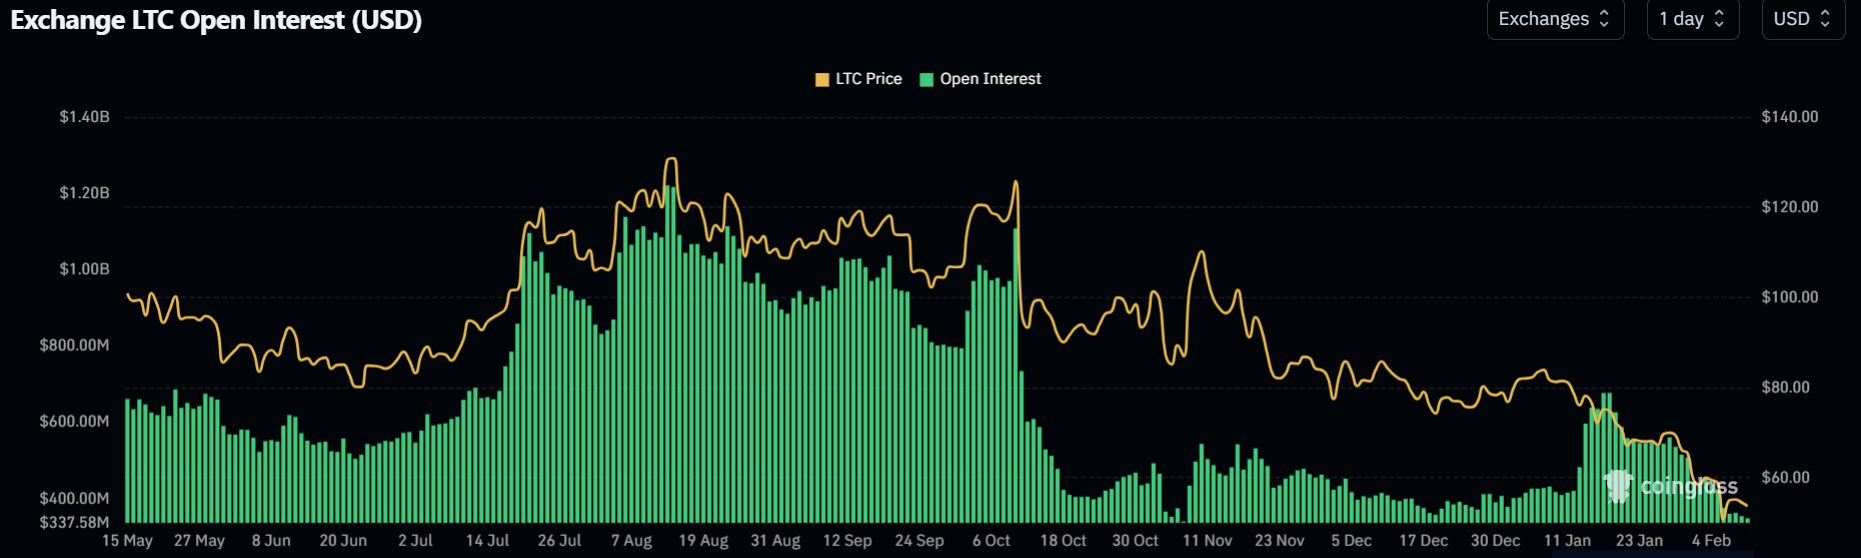
Open interest is the total worth of outstanding contracts in a derivatives market, while funding rates are periodic payments between traders to keep the price of a perpetual contract anchored to its underlying spot price.
Litecoin Price Forecast: LTC sees rejection at $57, eyes $50 support
Litecoin saw a rejection at $56.4 over the weekend and is approaching the $50 support level. A decline below $50 could push the top altcoin to find support at Friday's low of $45 — its lowest level since June 2022.
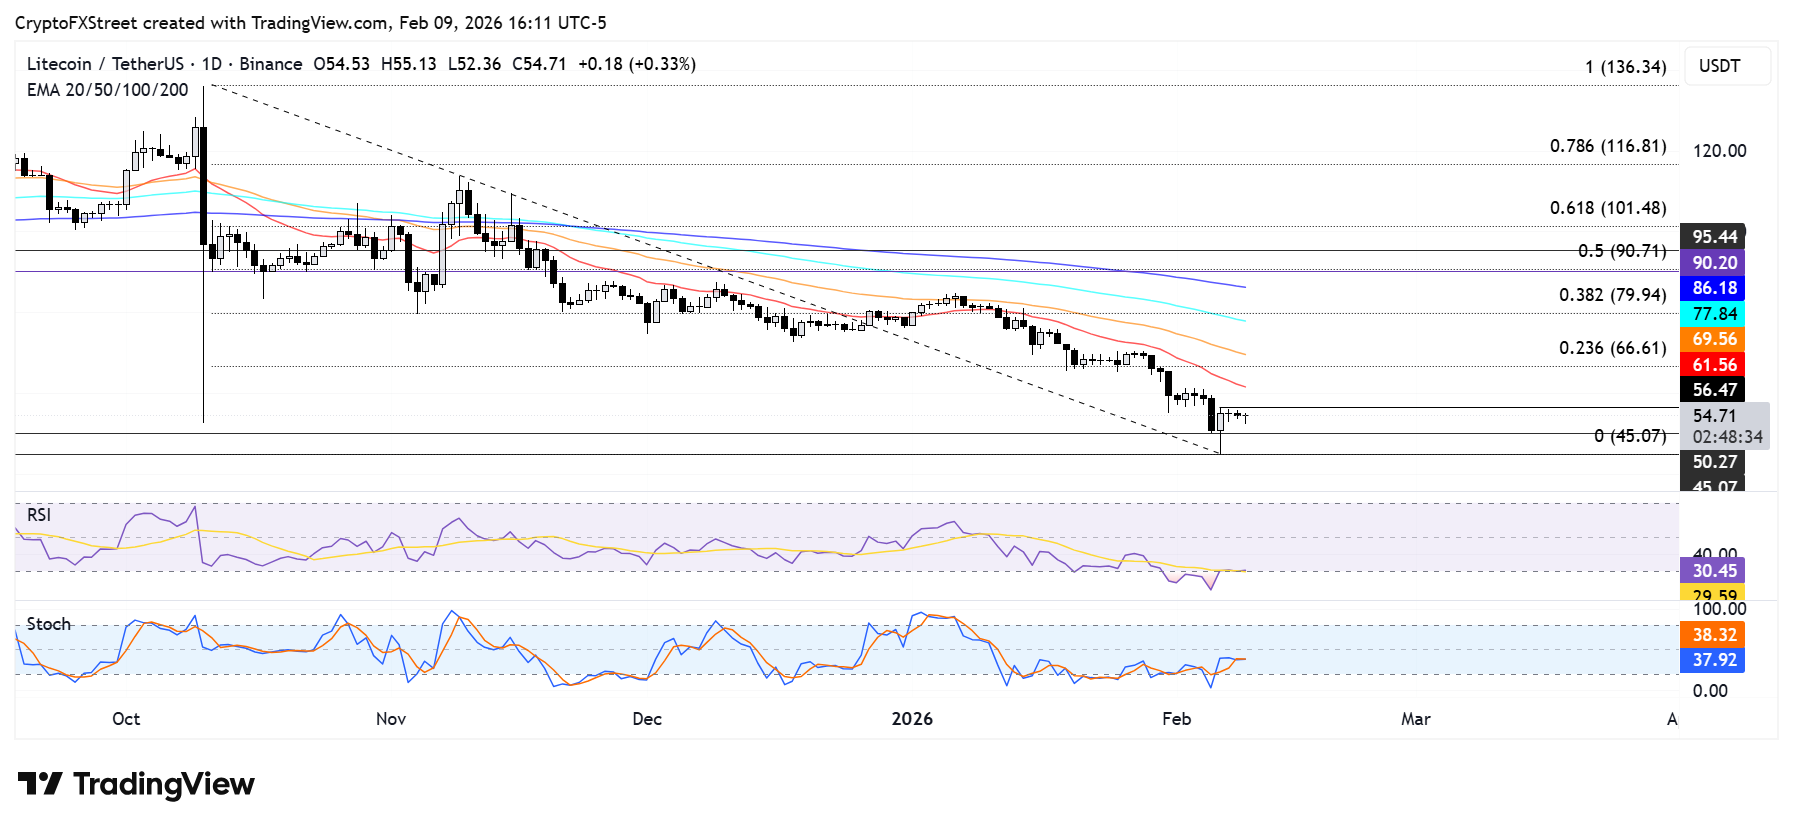
On the upside, LTC could test the 20-day Exponential Moving Average (EMA) if it clears the $56.4 resistance.
The Relative Strength Index (RSI) is in the oversold region while the Stochastic Oscillator (Stoch) is below its neutral level, indicating a dominant bearish momentum.
Recommended Articles


Comments (0)
Click the $ button, enter the symbol, and select to link a stock, ETF, or other ticker.