


Analyst Says Shiba Inu’s $0.000010 Support Could Trigger Major Bounce



According to reports, Shiba Inu (SHIB) fell 4.50% in the past 24 hours as the wider market moved sideways. The token’s seven-day retracement likewise sits at 4.50%, and it is down about 35.5% year-to-date while trading outside the top 20 cryptocurrencies by market cap. At the time of reporting, SHIB’s market price was $0.00001261.
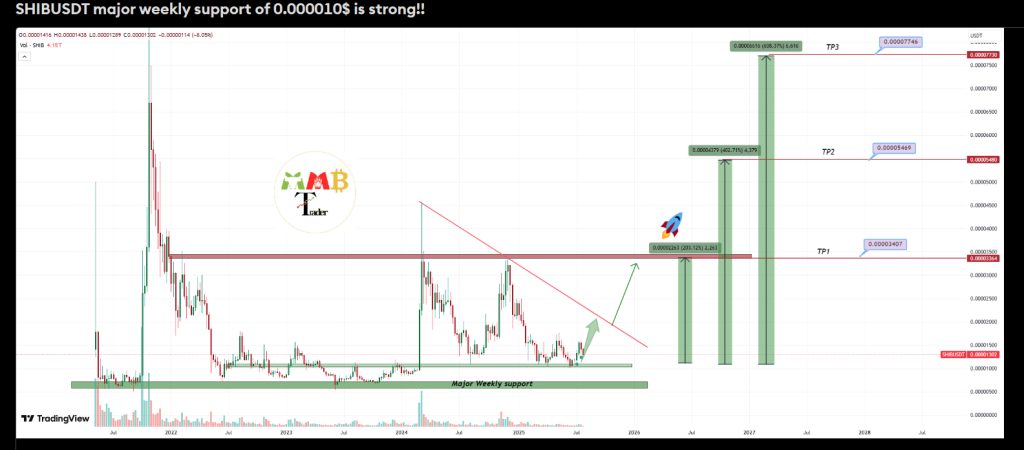
Shiba Inu Weekly Support Levels Hold
Analyst MMB Trader has pointed to two weekly support lines at $0.000010 and $0.000007 that have repeatedly absorbed selling pressure. SHIB dropped to $0.00000714 in July 2022 after an 88% fall from its 2021 peak of $0.00008854, and buyers pushed it back up.
The popular memecoin came back to that area in June and October 2023 and regained footing. This year, the token revisited around $0.000010 in March, April, and June and bounced each time. Those moves suggest there are price zones where demand has shown up.
Analyst’s Targets And Recent History
Based on reports, the analyst laid out a step-up of targets if SHIB clears its descending trendline. The first target is $0.00003364, a close to 170% rise from $0.00001249 at the time of reporting.
The next level is $0.00005480, an increase of approximately 330%, and a distance benchmark at $0.00007716 suggests around 500% increase. SHIB’s own past provides some background: it climbed from $0.00000967 to $0.00004567 on March 5, 2024, on a meme-coin frenzy, and regained to $0.00003343 in December 2024 before again retreating.
Models also give more modest short-term views; one forecast puts SHIB at $0.00001324 by September 17, 2025. Big swings have happened here before, but they came with heavy volume and wide attention.
Market Snapshot And CloseCurrent sentiment measures look mixed. The Fear & Greed Index reads 60, which sits in the Greed zone, while technical indicators show a Bearish tilt at the moment. SHIB recorded 14/30 green days (47%) and roughly 7.02% price volatility over the last 30 days.
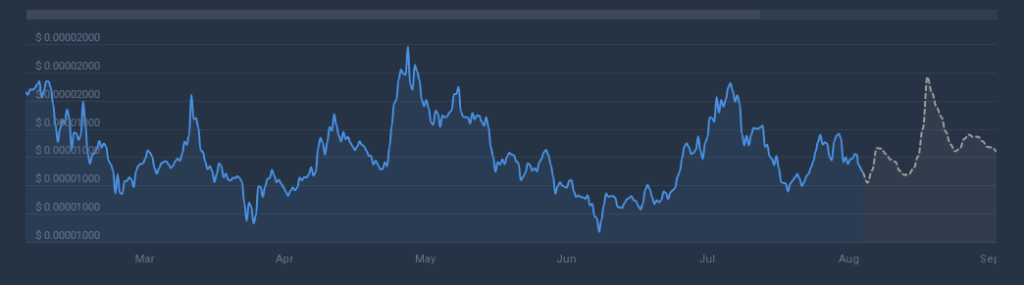
Traders should note that those readings can flip quickly. If weekly support holds and a catalyst pushes volume up, the mood could shift. If those supports fail, the picture could darken fast.
Meanwhile, volume and on-chain flows will be crucial going forward. A breakout candle that lacks rising volume may not last. Watch exchange inflows and whale transfers because large moves onto exchanges often precede selling.
Featured image from Meta, chart from TradingView
Recommended Articles








Comments (0)
Click the $ button, enter the symbol, and select to link a stock, ETF, or other ticker.