


Bitcoin–S&P 500 Correlation Hits 80%, Tying Crypto To Stocks



Bitcoin is trading around key levels after reclaiming the $115,000 mark, with bulls firmly in control despite ongoing consolidation below the $120,000 threshold. The trend remains bullish, supported by steady buying interest and strong technical positioning.
Key data shows that the correlation between Bitcoin and the S&P 500 has surged to 80%. In this high-correlation regime, a continued rally in US equities could provide Bitcoin with a tailwind toward new highs, while an equity pullback could amplify downside volatility.
With the S&P 500 currently in a bullish phase, BTC appears to be tracking the same trajectory. Still, market watchers caution that such high correlation levels are often short-lived and prone to sharp reversals. For now, traders are closely monitoring both equity and crypto charts, knowing that any shift in risk appetite across traditional markets could quickly ripple into Bitcoin’s price action.
S&P 500 Correlation Strengthens Bitcoin’s Macro Link
According to top analyst Axel Adler, the recent 80% correlation between Bitcoin and the S&P 500 underscores how deeply macroeconomic forces are influencing the crypto market. In this environment, key drivers such as interest rate expectations, liquidity conditions, and the broader risk-on/risk-off sentiment are directly transmitted to BTC’s price action.
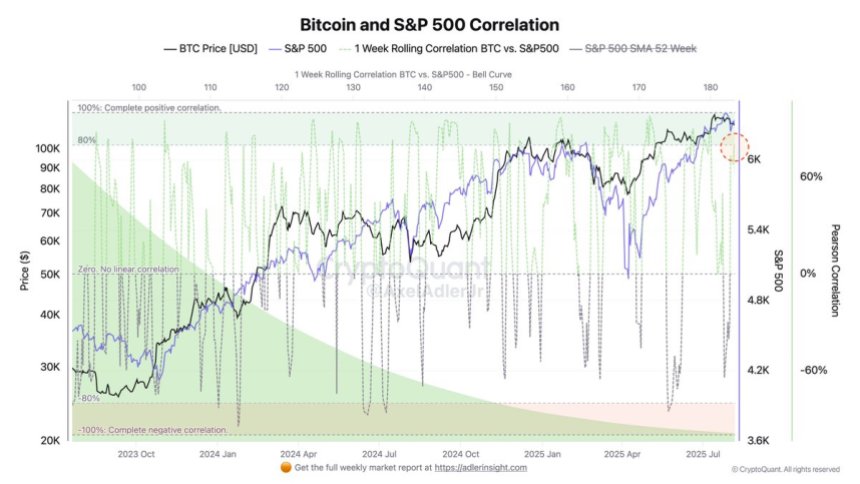
Under this regime, a sustained recovery in US equities will likely provide a supportive backdrop for Bitcoin. Conversely, if stock markets experience a downturn, the negative sentiment could quickly spill over into the crypto space, amplifying sell-offs and triggering broader market weakness.
Adler points out that the current reading is based on a 1-week rolling correlation metric, which is inherently volatile. Historically, such correlation spikes are rarely sustained for long periods. The present level, while significant, is unlikely to hold for more than a few weeks before reverting toward its mean.
Despite the short-term nature of this spike, the analyst emphasizes that the growth of crypto adoption in the US—from institutional products like ETFs to corporate treasury allocations—sets the stage for a bullish long-term outlook. Still, traders must remain mindful that macroeconomic downturns, tightening liquidity, or shifts in Federal Reserve policy could rapidly reverse market sentiment.
Bitcoin Price Analysis: Bulls Defend Key Support
Bitcoin (BTC) is trading around $116,565, holding steady after reclaiming the $115,724 support level, which coincides with a key horizontal zone from late July. On the 4-hour chart, BTC recently broke above the 50-day, 100-day, and 200-day SMAs, signaling short-term bullish momentum. These moving averages, now converging near $116,000, could act as a strong support cluster if tested again.
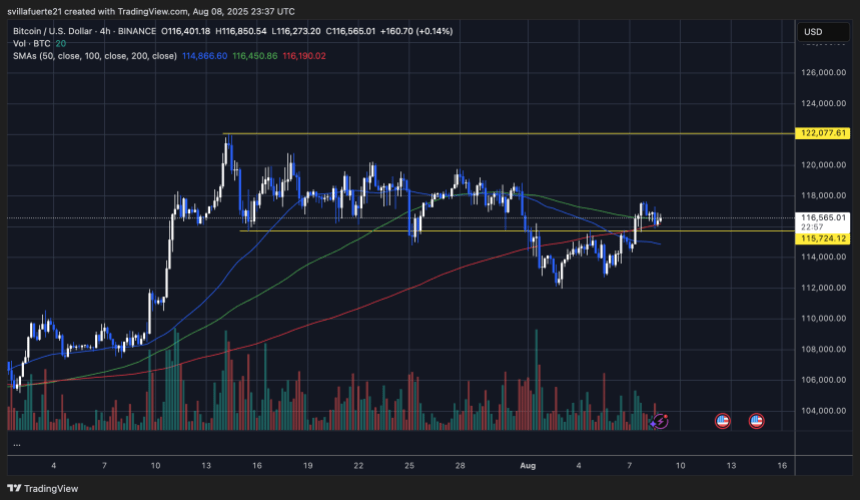
The immediate upside target remains the $122,077 resistance, last tested in mid-July. However, BTC has faced selling pressure near $117,000, indicating short-term consolidation before a possible push higher. Volume has tapered slightly after the breakout, suggesting that buyers may need fresh momentum to sustain the move.
If BTC holds above $115,724 and the moving average cluster, bulls could attempt a breakout toward the $118,000–$122,000 zone. However, rejection might trigger a retest of $115,724, with a deeper pullback.
Featured image from Dall-E, chart from TradingView
Recommended Articles









Comments (0)
Click the $ button, enter the symbol, and select to link a stock, ETF, or other ticker.