


Bitcoin Inflows To Binance Accelerate: Investor Behavior Shifts After Months Of Decline



After weeks of consolidation within a tight range, Bitcoin has broken down below the crucial $115K level, reaching a local low around $112,200. This correction has sparked a divide among analysts and investors, with some viewing it as a healthy retracement that could set the stage for a continuation of the broader uptrend. Others, however, warn that this move might signal the beginning of a more extended bearish phase if key support levels fail to hold.
Adding to the market’s uncertainty, top analyst Darkfost highlighted a significant shift in exchange activity. Data reveals that Bitcoin inflows to Binance have been steadily rising since early July, reversing a prolonged downtrend that had been in place since March.
Given Binance’s position as the largest global crypto exchange by volume, this uptick in inflows is a crucial indicator of shifting investor behavior. Whether this trend signals an upcoming wave of selling or simply reflects portfolio rebalancing remains to be seen. The coming days will be pivotal as Bitcoin tests its lower demand zones and market sentiment reacts to this new data.
Binance Bitcoin Inflows Signal Shift in Market Mood
Darkfost shared critical data showing that Bitcoin inflows to Binance have steadily increased, rising from approximately 5,300 BTC daily in early July to 7,000 BTC today. While this uptick is not abrupt, it marks a significant reversal of a prolonged downtrend that had persisted since March. This change suggests that investor behavior is shifting, potentially signaling adjustments in market strategies as traders and institutions respond to evolving market dynamics.
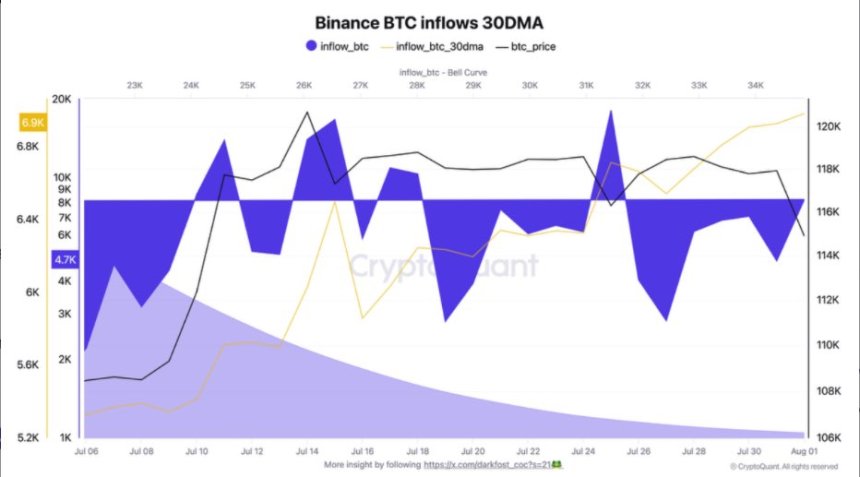
Binance, as the largest cryptocurrency exchange globally by trading volume, serves as a critical barometer for overall market sentiment. With over 250 million users and billions of dollars in daily transactions, fluctuations in Bitcoin inflows on this platform often mirror broader structural moves within the crypto market. Historically, rising inflows have been associated with increased trading activity, whether due to profit-taking, portfolio rebalancing, or anticipation of market volatility.
Some analysts interpret this emerging trend of accelerating inflows as an early sign of preparation for heightened market volatility or impending macroeconomic shifts. It could indicate that traders are positioning funds on exchanges to either capitalize on price swings or hedge against potential downside risks.
While the magnitude of inflows isn’t alarmingly high yet, the consistency of this rise demands attention. The market is watching closely to see whether this signals a temporary adjustment or the start of a broader trend. With Bitcoin’s price currently testing lower support zones after breaking below $115K, the behavior of these inflows will be pivotal in determining short-term price action.
Key Support At Risk Amid Increased Selling Pressure
Bitcoin is trading at $112,477 after breaking down from its two-week consolidation range. The price lost the crucial $115,724 support, which now flips into immediate resistance. This breakdown marks a significant shift in momentum, with BTC testing the 100-day simple moving average (SMA) at $114,944, which failed to hold. The next key support zone lies near the 200-day SMA at $110,348, a level that could become pivotal for bulls attempting to regain control.
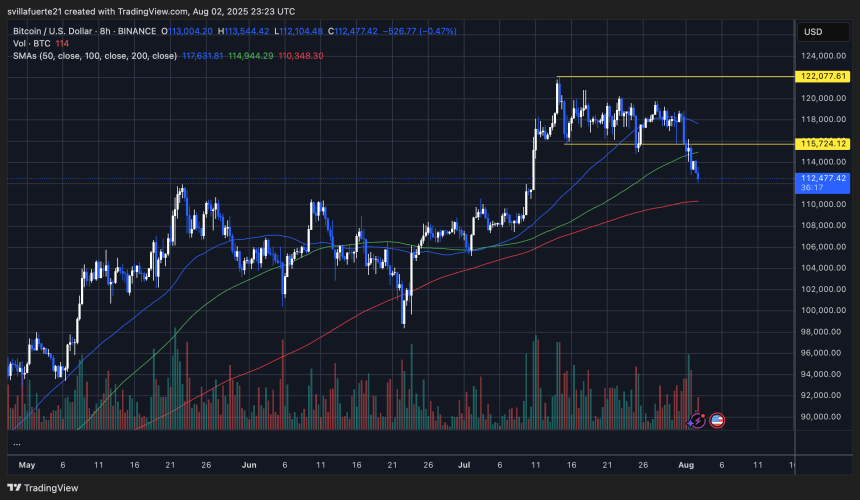
Volume has surged during this decline, indicating strong selling pressure as BTC approaches the $112,000 level. If the price fails to hold above this zone, a further drop towards the psychological $110K level seems likely, with potential for a deeper correction targeting previous accumulation ranges from early July.
Despite the bearish short-term outlook, bulls still have a chance to reclaim momentum if they can swiftly push BTC back above $115,724 and establish a consolidation above the 50-day SMA at $117,631. Until then, market sentiment remains cautious as investors watch for signs of demand absorption or further liquidation-driven declines.
Featured image from Dall-E, chart from TradingView
Recommended Articles









Comments (0)
Click the $ button, enter the symbol, and select to link a stock, ETF, or other ticker.