


Solana Bubble Maps Turn Neutral – Is This The Setup For A SOL Summer Rally?



Solana (SOL) has surged 6.6% over the past week, raising hopes among holders that the digital asset may be on the cusp of a significant rally – one that could potentially propel it to new all-time highs (ATH). A combination of strengthening fundamentals and bullish technical signals supports this optimistic outlook.
Solana Primed For A Spectacular Summer?
According to a recent CryptoQuant Quicktake post by contributor burakkesmeci, SOL is currently undergoing a cooling phase on both the spot and futures Bubble Maps. The analyst shared the following chart to highlight this cooling period.

For the uninitiated, a bubble map visualizes volume data across exchanges, with each bubble representing trading activity for a specific pair or platform. The size of the bubble indicates the total volume, while the color shows the intensity or change in that volume – such as cooling (green), neutral (gray), or overheating (red).
At first glance, lower trading volume might seem like fading momentum. However, the CryptoQuant analyst suggests this deceleration could be a strategic accumulation phase, particularly as a potential catalyst looms on the horizon.
Many in the crypto community are expecting the US Securities and Exchange Commission (SEC) to approve the first Solana exchange-traded fund (ETF) in the coming weeks. In an X post published today, Eric Balchunas, Senior ETF Analyst at Bloomberg, said Solana could lead a “potential altcoin ETF summer.”
Meanwhile, predictions platform Polymarket currently places a 91% probability on a Solana ETF being approved in 2025 – the highest odds recorded since January of this year. Most speculators expect a SOL ETF to go live by July 2025.
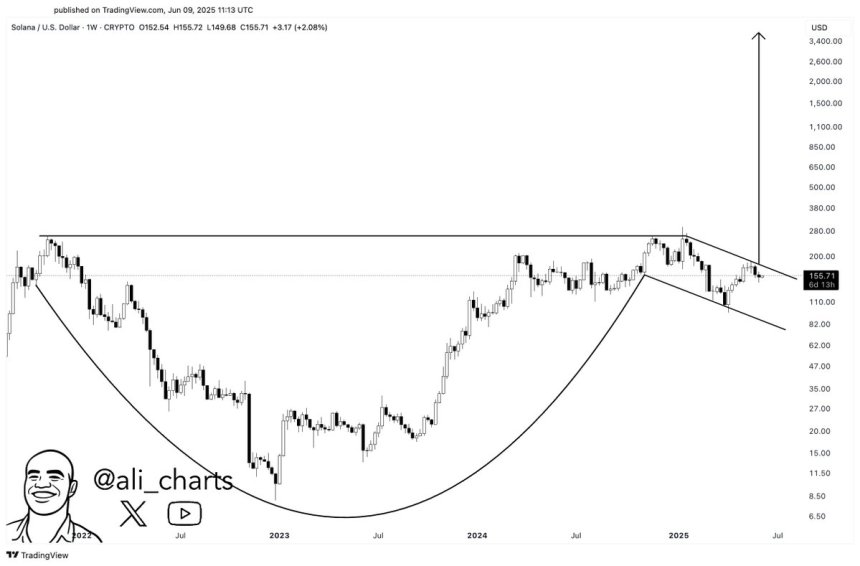
From a technical standpoint, things are also looking encouraging. In a recent X post, crypto analyst Ali Martinez remarked that if SOL breaks above the $200 mark, it could kickstart a 5x to 10x bull run.
Martinez shared the following SOL weekly chart, which shows the digital asset forming a bullish Cup and Handle pattern. While the “cup” portion has already been completed, the emerging “handle” suggests the potential for significant price appreciation – possibly pushing SOL beyond $2,000.
SOL Showing Promise But Take Caution
Despite widespread optimism, some indicators urge caution. On-chain data recently revealed a large movement of dormant SOL coins, which has raised concerns about increased selling pressure in the near term.
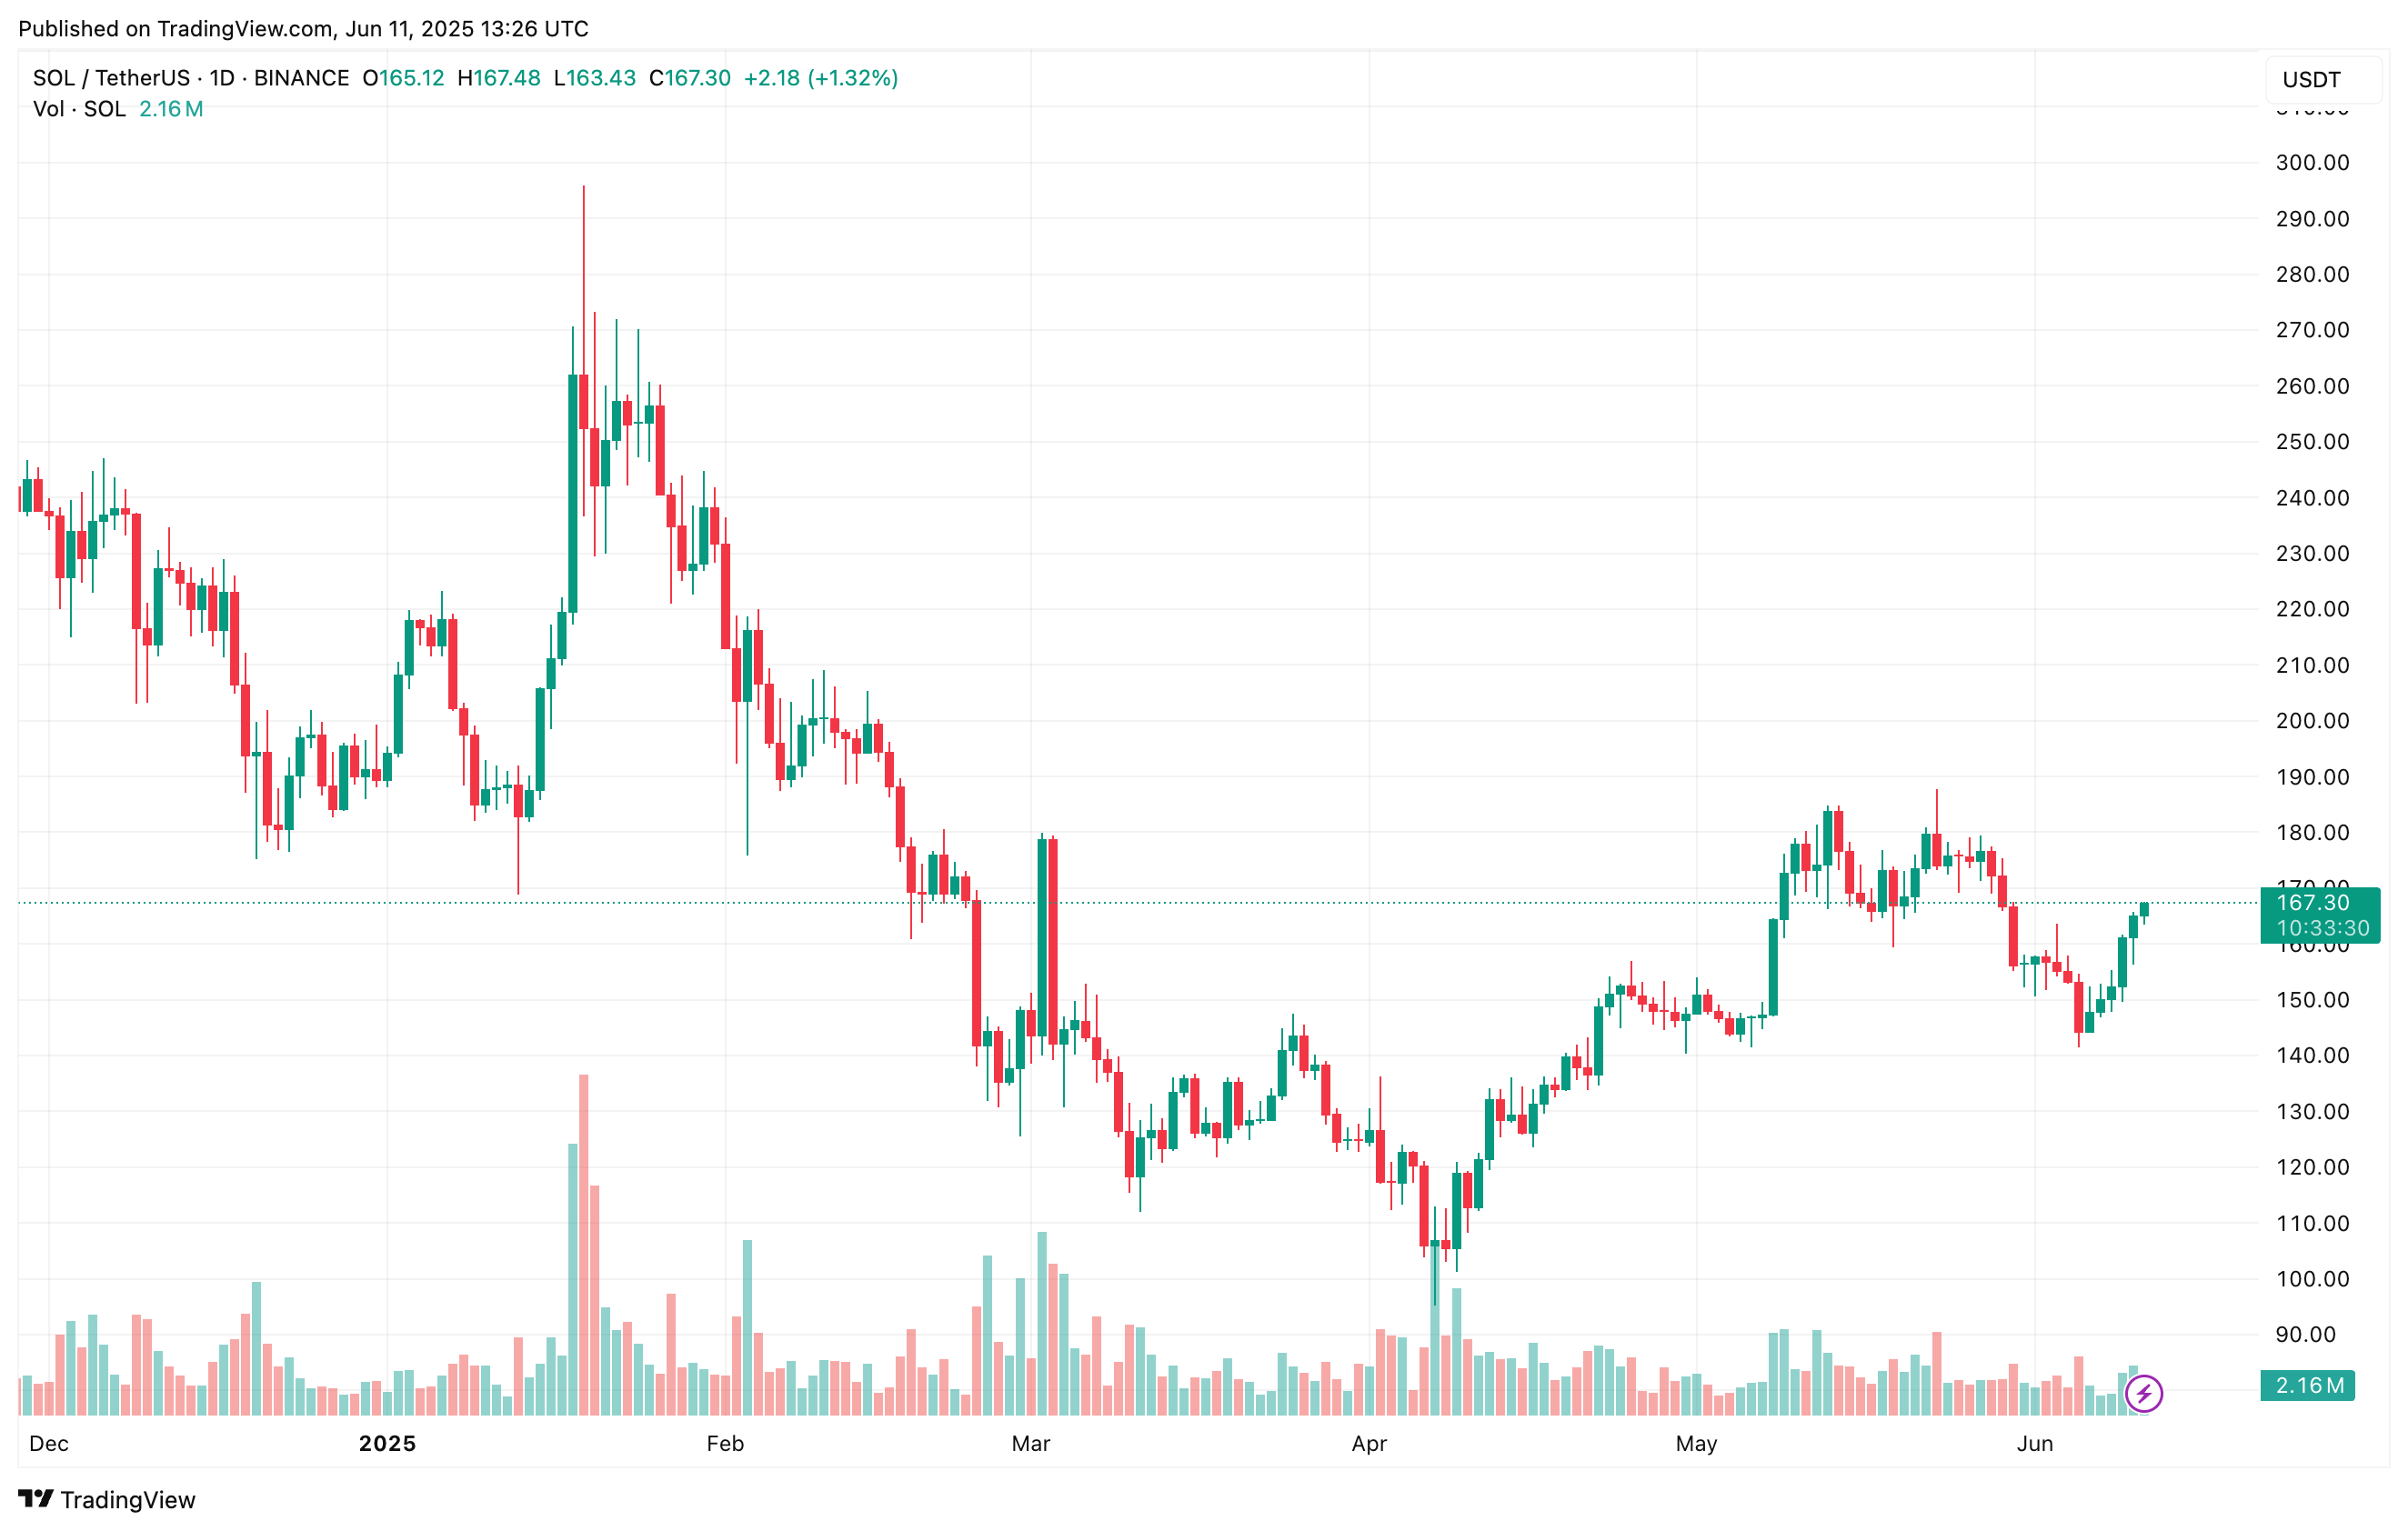
That said, a considerable number of analysts believe that SOL could surpass its current ATH of $293 later this year. At press time, SOL trades at $167.30, up 3.5% in the past 24 hours.
Recommended Articles









Comments (0)
Click the $ button, enter the symbol, and select to link a stock, ETF, or other ticker.