


Ethereum Flashes Golden Cross On Daily Chart – Is A New ATH Within Reach?



Ethereum (ETH), the second-largest cryptocurrency by market cap, may finally be awakening from its slumber. It recently flashed a bullish golden cross on the daily chart – a signal that has many crypto analysts forecasting a potential new all-time high (ATH) in the near future.
Ethereum Flashes Bullish Golden Cross
In an X post published today, crypto analyst Titan of Crypto noted that ETH has formed a golden cross on its daily chart. He shared the following chart and remarked that bullish momentum appears to be building for Ethereum.

To explain, a golden cross is a bullish technical pattern that occurs when a short-term moving average (MA) – typically the 50-day – crosses above a long-term MA like the 200-day. It signals a potential shift in momentum and is often seen as an indicator of a sustained upward trend.
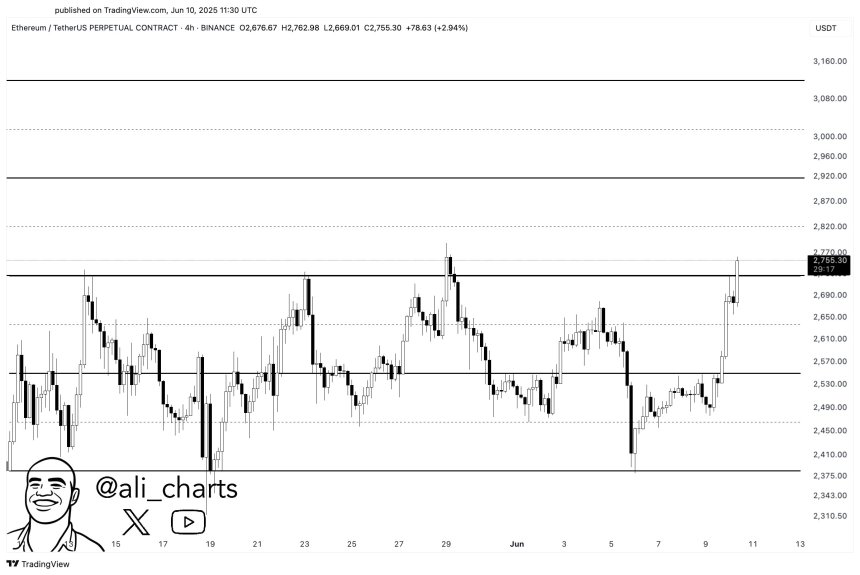
Meanwhile, seasoned crypto analyst Ali Martinez commented on ETH’s recent price action. He noted that Ethereum has broken resistance on the 4-hour chart and could be setting up for a move as high as $2,920 in the coming days.
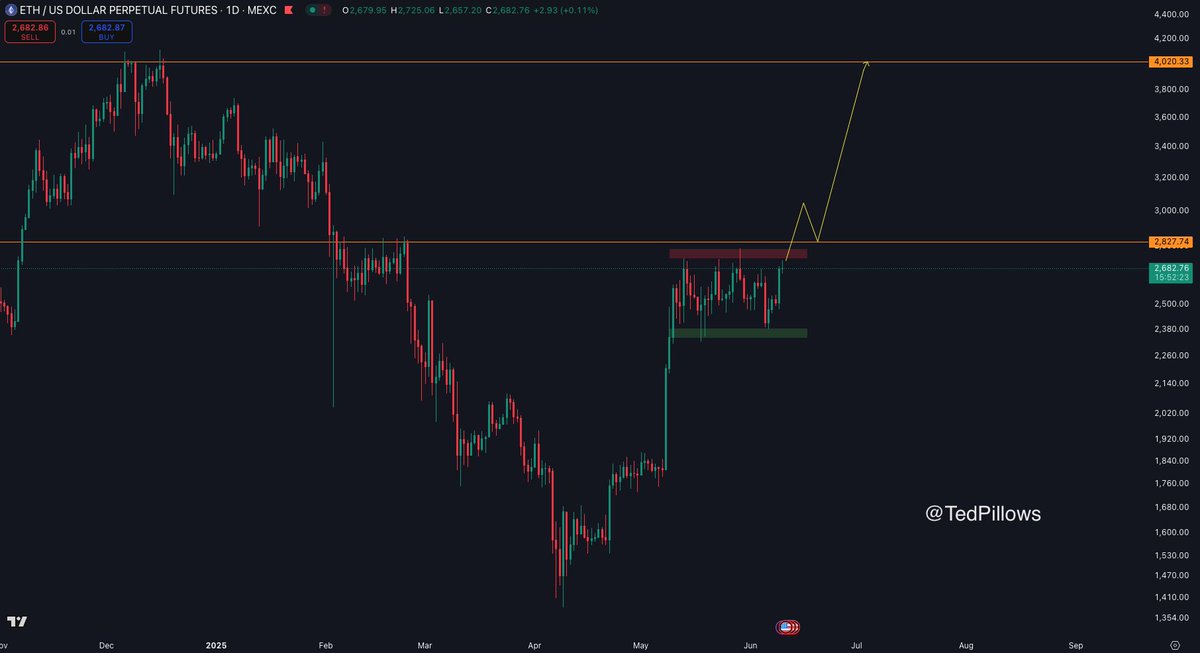
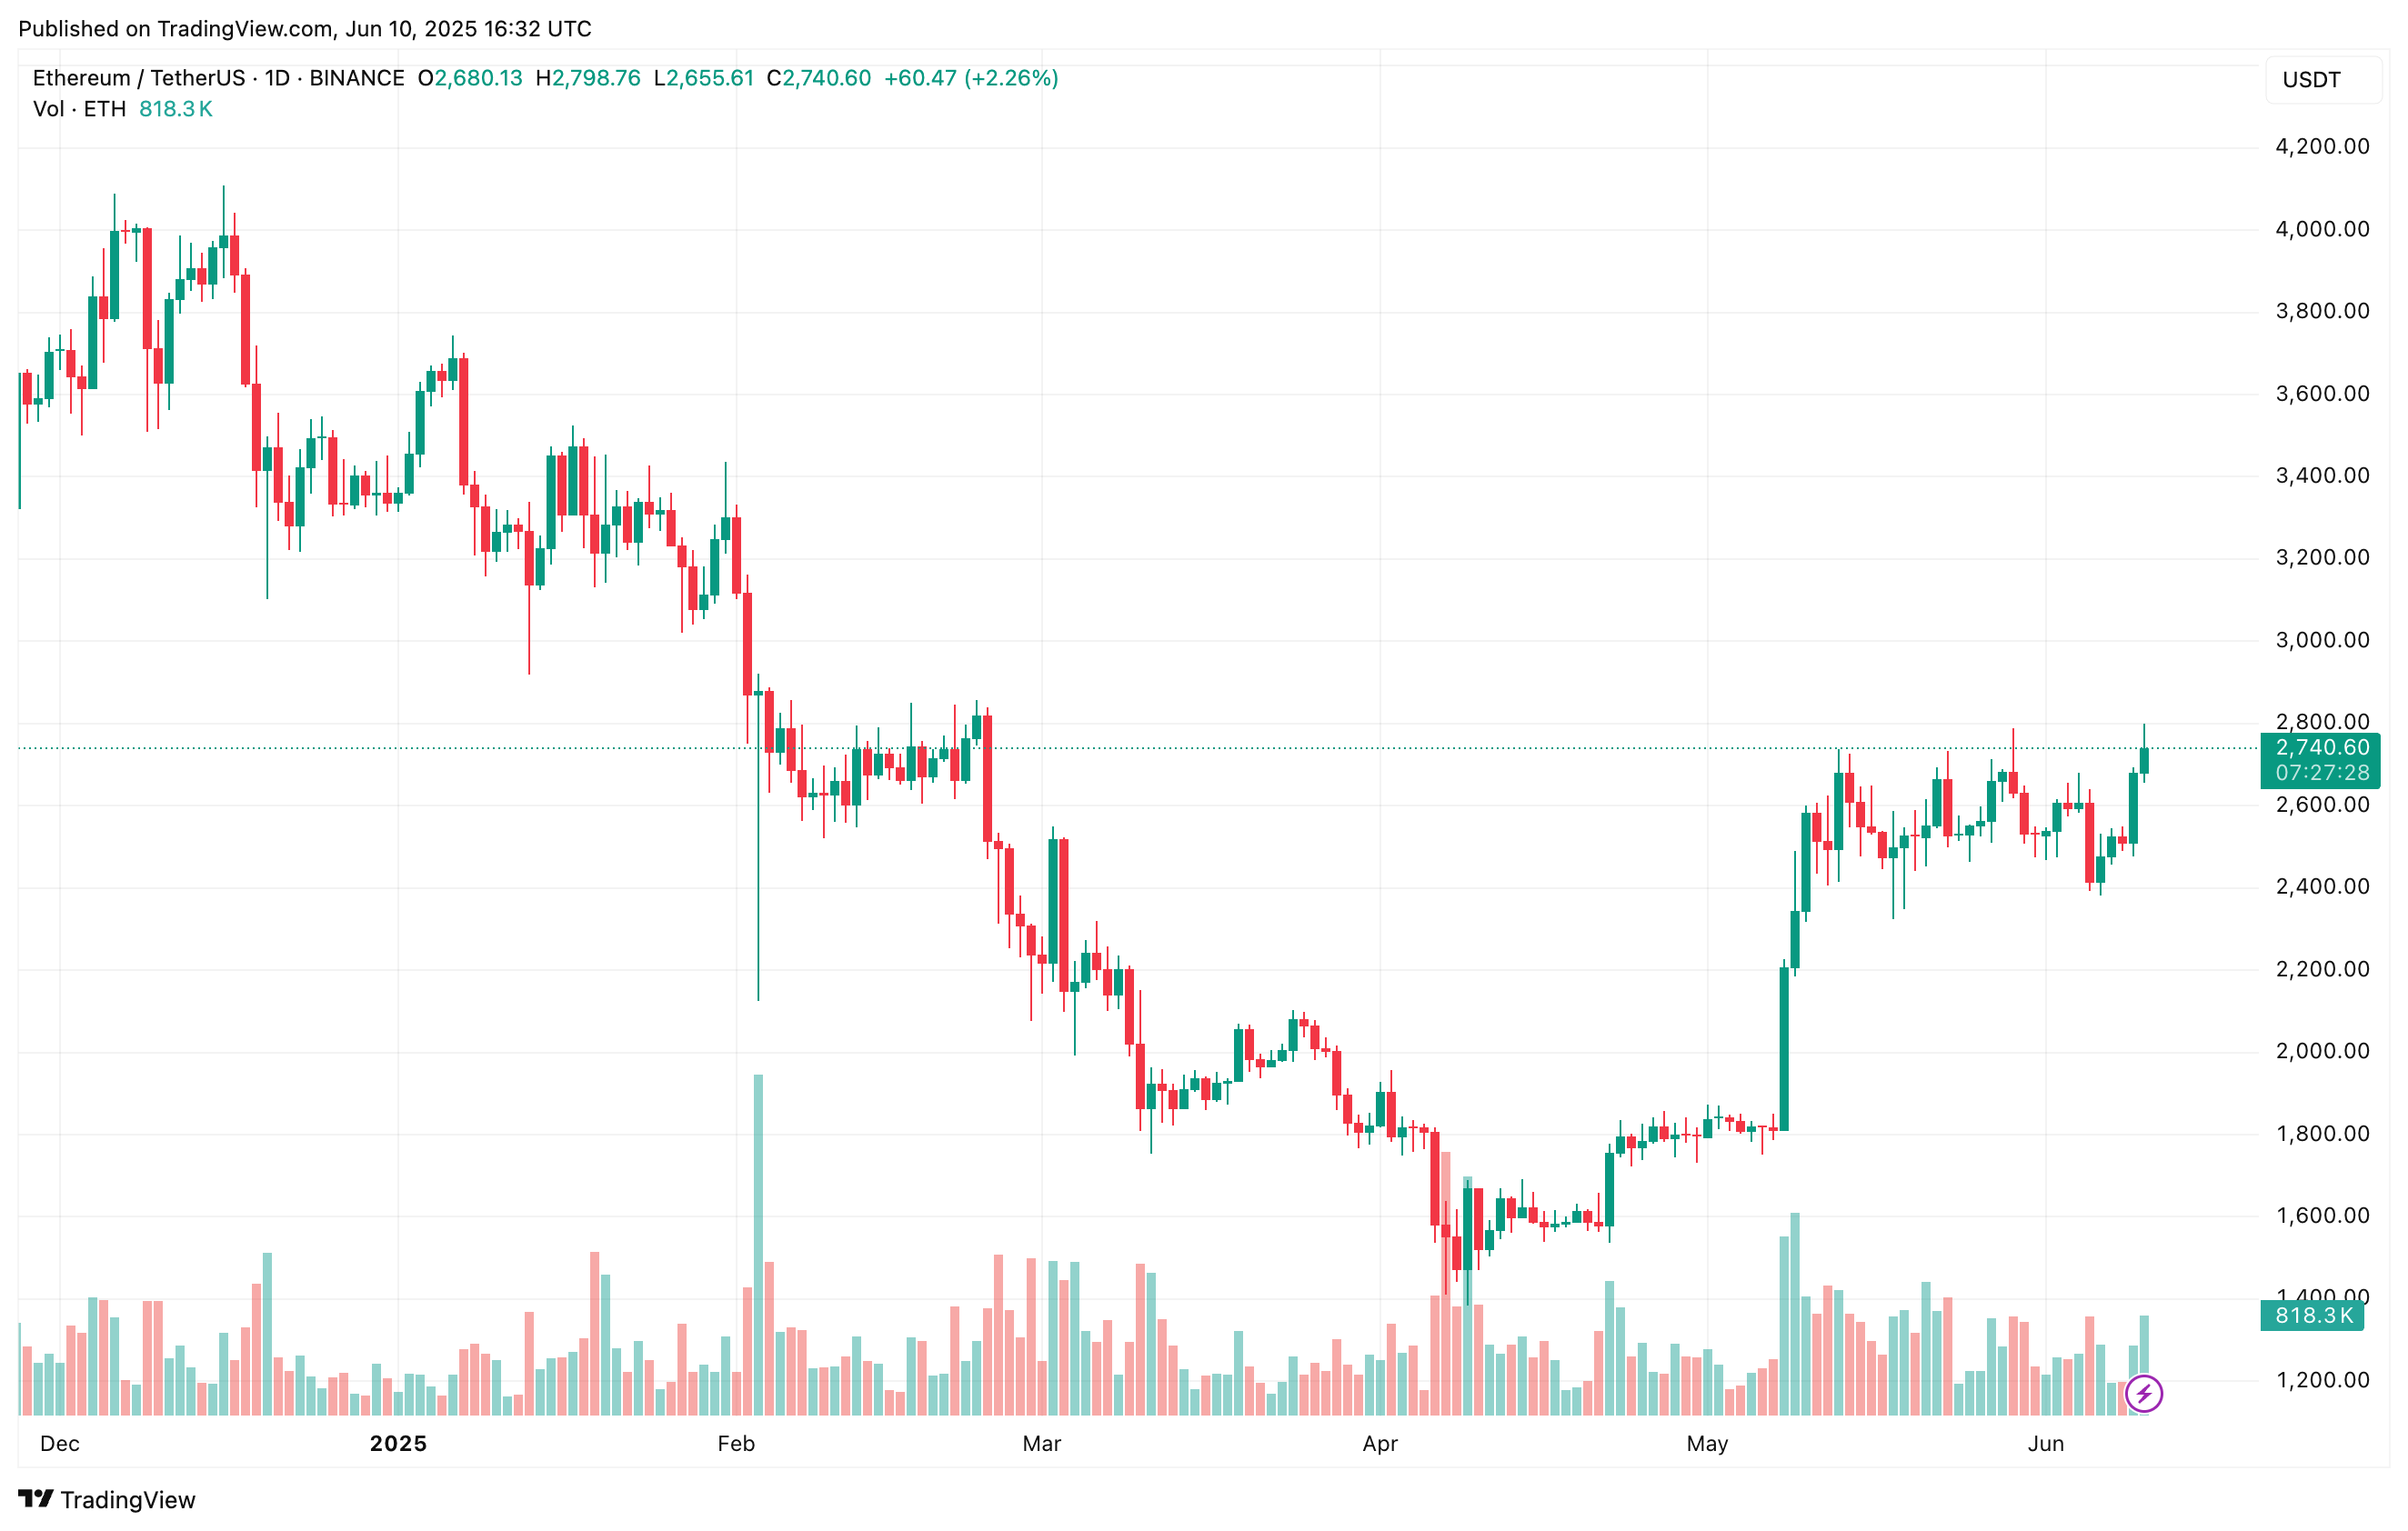
Fellow market commentator Ted Pillows echoed a similar view. He stated that ETH is currently trading at a local range high, pushing against a key resistance level at $2,800. Pillows suggested that the digital asset might reach $4,000 later this month.
Multiple technical indicators and market structure patterns are also hinting at near-term upside for ETH. For instance, crypto trader Merlijn The Trader observed a hidden bullish divergence on the 12-hour chart.
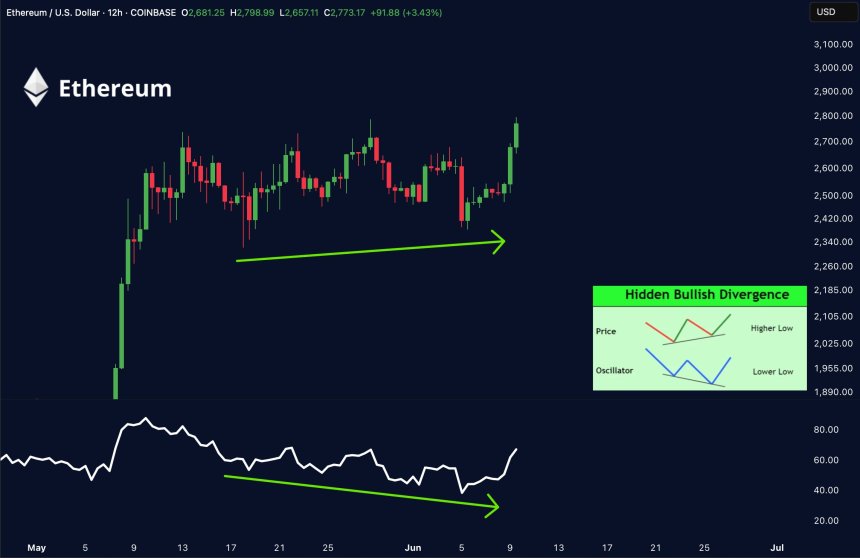
A hidden bullish divergence occurs when price forms a higher low, while a momentum indicator – such as RSI or MACD – forms a lower low. This setup suggests that although momentum appears weak, the underlying trend remains intact, and a price continuation to the upside is likely.
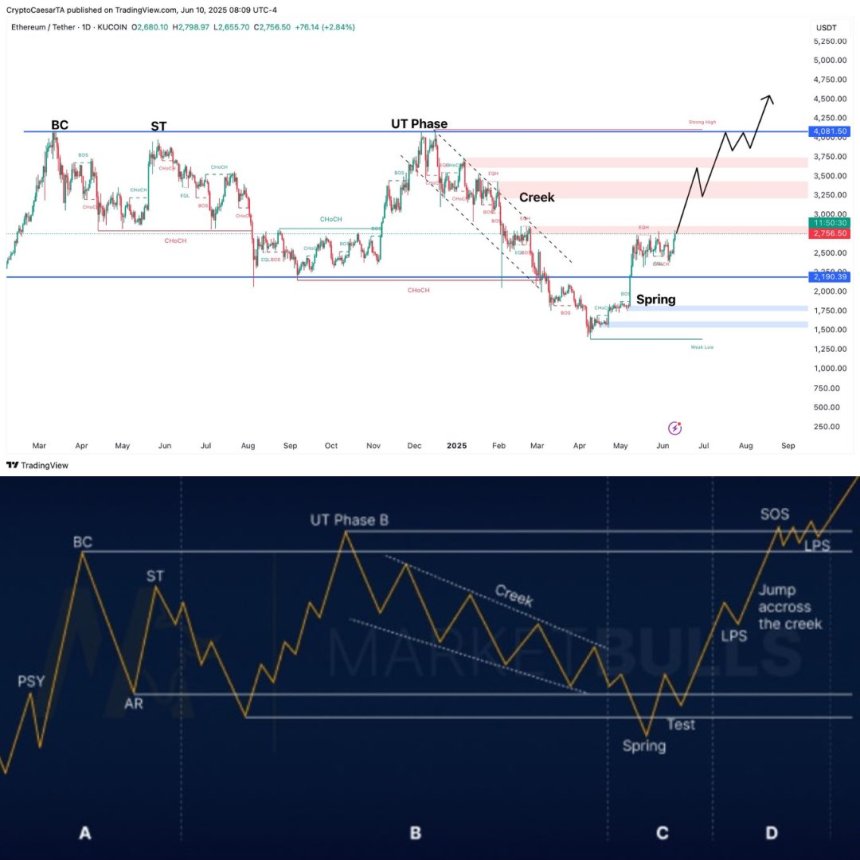
In a similar vein, digital assets analyst Crypto Caesar pointed out that Ethereum’s Wyckoff Accumulation pattern is “still playing out perfectly.” He shared a chart predicting that ETH may hit a new all-time high by August 2025.
All Indicators Point To Further Upside
Beyond the technical patterns, other on-chain and market indicators continue to support the bullish thesis. For instance, even after gaining over 11% in the past two weeks, Ethereum’s funding rates remain relatively neutral – a sign that the rally may still have room to grow.
Additionally, ETH is eyeing a potential breakout to $3,500, with its price projected to surge above the crucial 50-day exponential moving average (EMA). At press time, ETH trades at $2,740, up 6.8% in the past 24 hours.
Recommended Articles









Comments (0)
Click the $ button, enter the symbol, and select to link a stock, ETF, or other ticker.