


Is Bitcoin Price Returning To $74,000? Analyst Identifies Pattern That Suggests So



The Bitcoin price had a rollercoaster journey over the past week, falling to its lowest level in six months on Wednesday, April 9. The flagship cryptocurrency showed some resilience, recovering above the $80,000 level after United States President Donald Trump paused trade tariffs on all countries except China.
BTC seems to be starting the weekend on a strong foot, returning to above $83,000 in the late hours of Friday. However, the price of BTC appears to be enjoying only a temporary relief, as a prominent crypto analyst has identified a pattern that could decide the coin’s trajectory over the next few weeks.
BTC At Risk Of Another Correction Due To Double Top Pattern
In an April 11 post on the X platform, crypto analyst Ali Martinez shared an interesting outlook on the price of Bitcoin following its recent recovery rally. According to the online pundit, this latest surge could be a precursor to another Bitcoin price correction to around the $74,000 level.
This bearish prediction is based on the potential formation of the “double top” pattern on the BTC hourly chart. The Double Top pattern is a technical analysis formation that looks like the letter “M”, consisting of two consecutive price tops.
The double top pattern is typically a rare appearance on most charts, indicating that investors are looking to book their profits from an extended bullish trend. Hence, the “M” pattern can be a strong signal of trader exhaustion and bearish reversal.
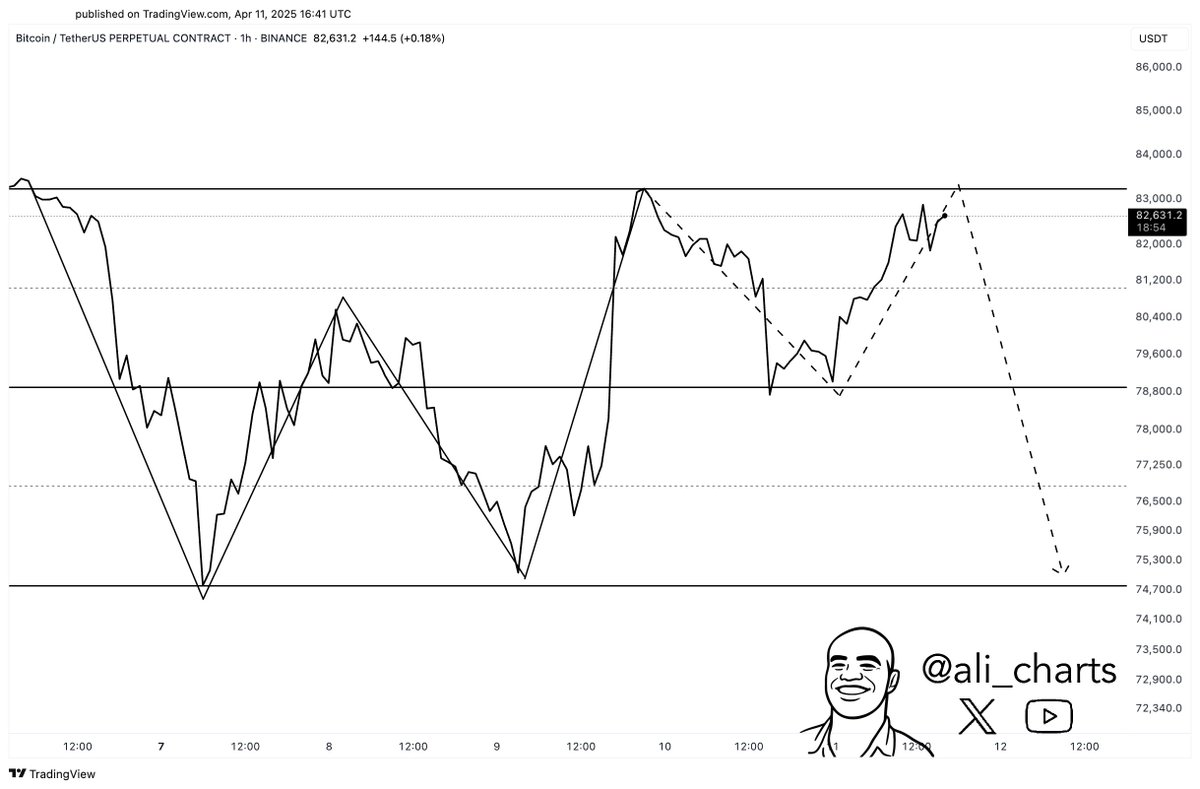
Interestingly, the above chart shows that the Bitcoin price just completed a “double bottom” pattern — the opposite iteration of the Double Top — on the hourly timeframe. The double top saw the premier cryptocurrency fall from above $83,000 to around $74,000 in the space of two days.
With the price of BTC seemingly topping out around the $84,000 mark, a potential “M’ pattern appears to be forming on the hourly chart. If the Bitcoin price fails to break the resistance around the $84,000, the market leader could be gearing for another price breakdown.
It is worth watching out for the support cushion around the $78,000 level, where the BTC price last bounced back to above $83,000. However, a confirmed close below this support region could imply a deeper correction toward $74,000 — a nearly 15% drop from the current price point.
Bitcoin Price At A Glance
As of this writing, the price of Bitcoin stands at around $83,800, reflecting an over 5% price jump in the past 24 hours.
Recommended Articles








Comments (0)
Click the $ button, enter the symbol, and select to link a stock, ETF, or other ticker.