Indicators
Indicators
Value
Direction
MACD(12,26,9)
-0.278
Sell
RSI(14)
41.612
Neutral
STOCH(KDJ)(9,3,3)
44.370
Buy
ATR(14)
1.512
High Vlolatility
CCI(14)
-1.234
Neutral
Williams %R
70.870
Sell
TRIX(12,20)
-0.141
Sell
StochRSI(14)
100.000
Overbought


180.129
Today
+0.66%
5 Days
+1.16%
1 Month
-2.48%
6 Months
-1.60%
Year to Date
-2.14%
1 Year
+3.26%
Opening Price
178.925Previous Closing Price
178.955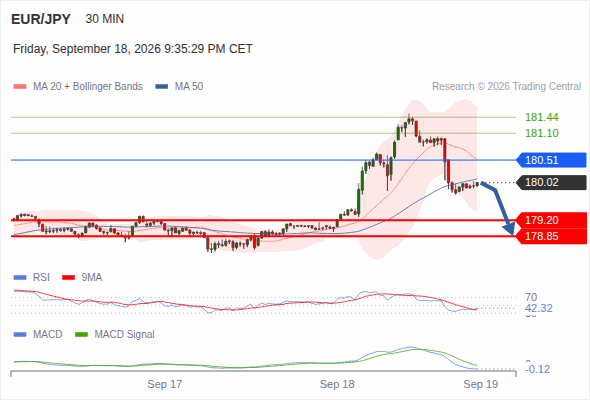
The downside prevails as long as 180.51 is resistance, with 179.20 and 178.85 as targets
above 180.51, look for 181.10 and 181.44.
The downside prevails as long as 180.51 is resistance, with 179.20 and 178.85 as targets
The Euro (EUR) extends gains against the Japanese Yen (JPY) on Friday, after some hesitation, amid the Bank of Japan (BoJ) Governor Ueda's hawkish rhetoric at the post-meeting press conference.
EUR/JPY rises after registering minor losses in the previous day, trading around 180.20 during Asian hours on Friday. The currency cross advanced as the Japanese Yen (JPY) struggled following the Bank of Japan's (BoJ) latest interest rate decision.
The EUR/JPY drops by about 0.08% on Thursday, forming back-to-back spinning tops near the 180.00 area, the top of a consolidation range capped to the downside by 178.00. At the time of writing, the cross-pair trades at 179.02, below its opening price.
EUR/JPY falls 0.25% on Thursday, trading around 178.70 at the time of writing and snapping a three-day winning streak. The strengthening Japanese Yen (JPY) weighs on the cross as investors anticipate another interest rate hike from the Bank of Japan (BoJ) on Friday.
EUR/JPY declines after three days of gains, trading around 178.90 during Asian hours on Thursday. Technical analysis of the daily chart shows the currency cross trading within a descending channel, keeping the overall bearish bias.
EUR/JPY gains ground for the third successive day, trading around 179.10 during Asian hours on Wednesday. Technical analysis of the daily chart shows the currency cross trading within a descending channel, keeping the overall bias bearish.
The Indicators feature provides value and direction analysis for various instruments under a selection of technical indicators, together with a technical summary.
This feature includes nine of the commonly used technical indicators: MACD, RSI, KDJ, StochRSI, ATR, CCI, WR, TRIX and MA. You may also adjust the timeframe depending on your needs.
Please note that technical analysis is only part of investment reference, and there is no absolute standard for using numerical values to assess direction. The results are for reference only, and we are not responsible for the accuracy of the indicator calculations and summaries.