A History Lesson: Is 2026 Like 2022?


AI Podcast
The S&P500 faces potential volatility driven by geopolitical conflicts disrupting energy supplies and rising oil prices, echoing 2022. Similarities include military conflict impacting energy markets and inflation risks prompting hawkish Fed discussions. However, current inflation is lower, and the job market is weaker than in 2022. The preceding liquidity-driven rallies also differ, with 2023-2025 gains more earnings-supported. Risks for 2026 include sustained high oil prices, potential Fed tightening, and AI earnings misses, suggesting a gradual "bubble deflation" rather than an abrupt 2022-style crash. Investors should manage risk, diversify, and monitor policy and oil price trajectories.
As of today, the S&P500 is still slightly down for the year – a stark contrast from the previous years of hefty returns. In fact, the last time we had a bear market was in 2022. The 2022 bear market was triggered by a perfect storm: Russia’s invasion of Ukraine, record-high inflation from supply shocks plus post-COVID demand surge, aggressive Federal Reserve rate hikes, and stretched valuations after a liquidity-fueled rally. Markets collapsed quickly but recovered rather quickly, too, in 2023 as inflation peaked.
Four years later, parallels exist: we have geopolitical conflict disrupting energy supplies, rising oil prices, and some Fed voices discussing potential hikes amid inflation risks.
But how similar and different are the conditions between these two periods?
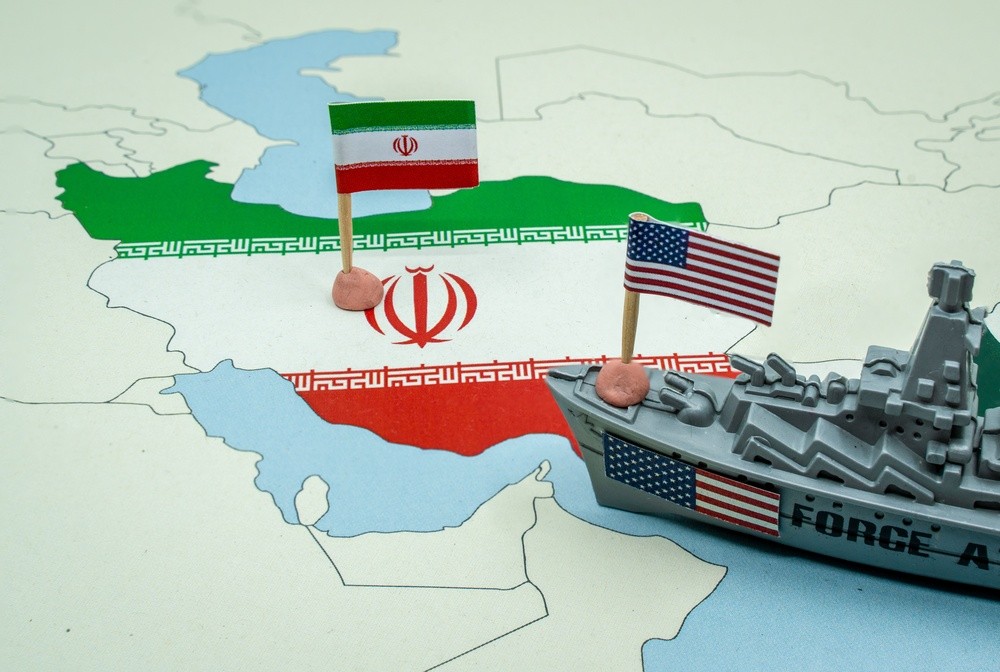
Similarity 1: Military Conflict and Energy Supply Disruptions
Both periods feature major conflicts beginning in February that involve oil-rich nations threatening global energy flows. In 2022, Russia (then the world’s third-largest producer and second-largest exporter at ~7.3–7.5 million barrels per day of crude, and also an exporter of the 11% of refined products globally) invaded Ukraine, disrupting European energy markets. Sanctions and physical disruptions sent oil and gas prices soaring.
In 2026, U.S. actions against Iran have escalated tensions in the Persian Gulf. While Iran’s direct crude exports do not have the scale of Russia's (~2 million b/d, ranking ~9th globally), its strategic control over the Strait of Hormuz is far more significant. The strait normally handles ~20 million barrels per day—roughly 20%, including flows from Saudi Arabia, Iraq, Kuwait, and the UAE, mostly destined for Asia. Thus, disruptions here create broader logistical bottlenecks than Russia’s 2022 role.
Gas and LNG dynamics also rhyme but differ: Russia was a top LNG exporter in 2021 (~8% of global trade); Iran itself exports little LNG, but Qatar and UAE together represent 20–25% of global supply, with heavy reliance on Hormuz transit.
Feature | Russia (2021) | Iran (2025) |
Direct Exports | ~7.3 mb/d (Global Rank: 2nd/3rd) | ~2.0 mb/d (Global Rank: ~9th) |
Secondary Impact | Minimal (Stable transit via Ukraine) | Massive (Controls 20 mb/d transit) |
Primary Customers | EU (50%+) and China | China (90%+), India, UAE |
However, the nuance is that the 2022 Ukraine conflict was a full-scale ground war with broad domestic support in Russia. The 2026 Iran situation involves more limited (so far) direct engagement. This may remain the case as there is lower domestic U.S. support for the campaign and political limitations for the Trump administration, unlike what we have in Russia. However, prolonged closure or attacks on facilities (e.g., Kharg Island) could sustain elevated oil prices longer, with Brent having already surged significantly (reports of moves toward or past $100–120/bbl in early conflict phases, with forecasts revised sharply higher for 2026).
Similarity 2: Inflation Risks and Monetary Policy Response
2022 was defined by peak inflation (driven by both supply disruptions and massive fiscal stimulus/demand), levels unseen in recent decades, forcing aggressive Fed hikes that crushed valuations. Oil shocks amplified the cycle.
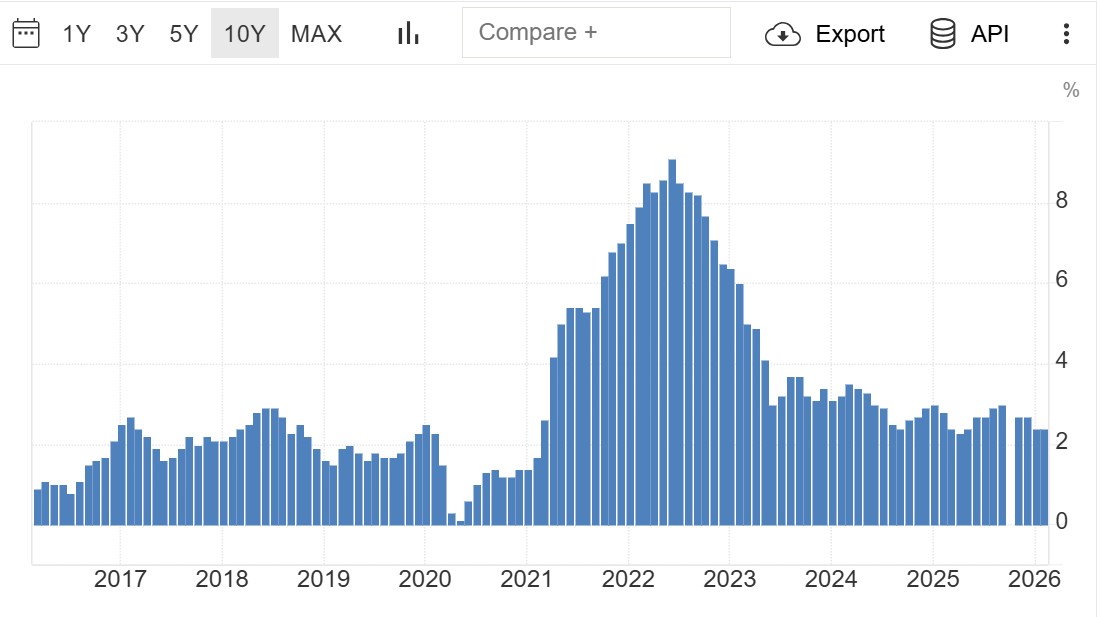
Source: U.S. Bureau of Labor Statistics
In 2026, headline inflation stood at a tame 2.4% YoY through February, well below 2022 peaks. However, the Iran conflict’s oil price surge has not yet fully fed through to CPI/PCE readings. Some Fed officials have begun discussing potential rate hikes—a notable shift from the dovish stance prevalent in 2025—while the central bank’s March 2026 minutes showed splits: many still expect cuts, but upside inflation risks from energy could alter the path. Markets price in limited cuts for 2026, with some scenarios even contemplating hikes if inflation reaccelerates.
2022 inflation was both supply and demand-driven, combined supply shocks due to the energy crisis and pent-up demand from excessive COVID-era stimulus. 2026 features primarily a supply-side oil shock against a backdrop of already softening demand. Pre-conflict inflation was contained but sustained high energy costs could push 2026 averages higher (some forecasts now see risks toward 4%+). The Fed’s reaction function will be critical: hikes could exacerbate any slowdown, while hesitation risks entrenching inflation.
Similarity 3: Preceding Liquidity-Driven Rallies Favoring Tech
In both situations, the precursors involved strong rallies fueled by liquidity and tech enthusiasm:
- 2020–2021 Post-COVID Rally: Zero rates, ~$5 trillion in fiscal stimulus, retail investor influx. Massive multiple expansion occurred, especially in software/SaaS names (e.g., Zoom as remote work boomed). Forward S&P 500 P/E exceeded 24x ahead of the 2022 drop.
- 2023–2025 AI Rally: Driven by Mag7 capex, private equity, and expectations around AI infrastructure/productivity. Gains centered on hardware (NVDA, AVGO, AMD) more than pure software multiples. Earnings growth played a larger role than in 2020–2021. As of early 2026, S&P 500 forward P/E sits around 21–23x (depending on exact measure), with Mag7 names often in the 20–30x range (e.g., META ~20x, NVDA ~20–26x, MSFT ~22x in recent snapshots).
The main difference here is that the post-COVID rally was heavily multiple-driven; the AI rally more earnings-supported—though concerns about over-investment and profitability delivery persist.
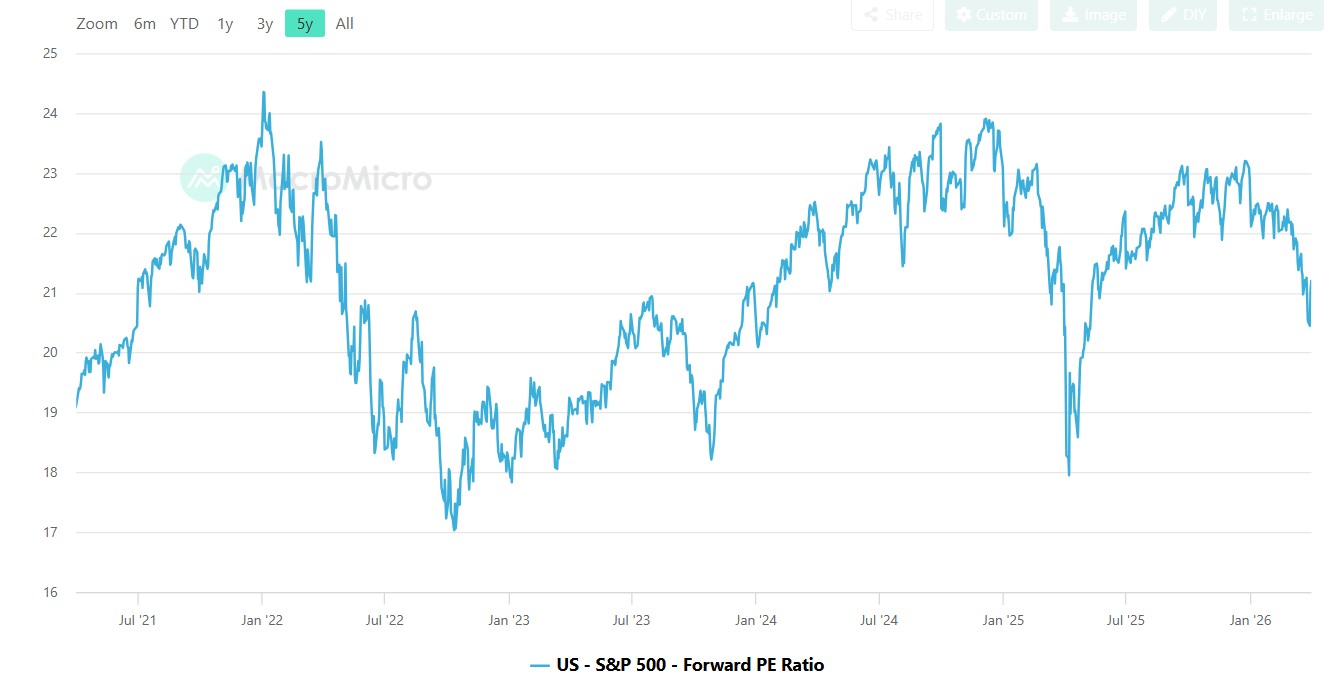
Source: MacroMicro
Big Difference: The Job Market and Consumer Sentiment
This is the starkest contrast. In 2021–2022, the labor market was extremely tight: unemployment ~3.5–3.7%, monthly job gains often 500k+, wage growth >5% YoY. Employers competed aggressively for workers; consumers, flush with savings and stimulus, went on a spending spree post-lockdowns.
In 2025–2026, the picture has flipped. Unemployment stands at 4.3% as of March 2026 (down slightly from 4.4% prior, partly due to labor force dropouts). Hiring remains anemic (~125k–178k/month recently), with employees more concerned about AI-driven displacement than wage bargaining power. Wage growth has moderated. Consumer sentiment reflects caution: spending is “K-shaped” (wealthy households sustain demand; others pull back amid job insecurity and higher costs).
This weaker labor backdrop limits demand-pull inflation but also reduces the economy’s resilience to shocks. A prolonged energy price spike could further erode purchasing power without the 2022-era buffer of tight jobs and stimulus.
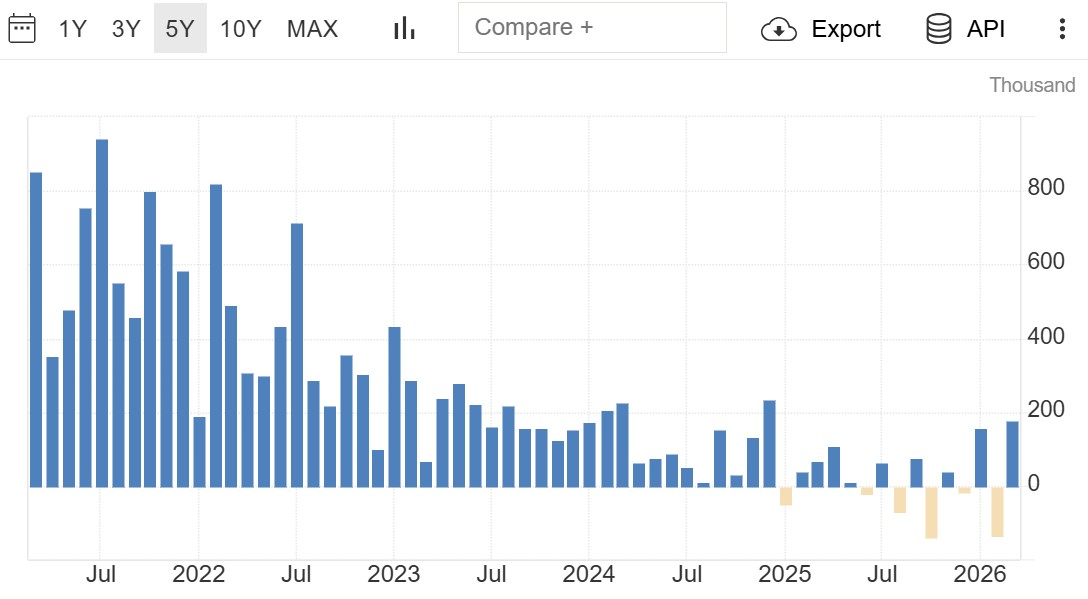
Source: U.S. Bureau of Labor Statistics
Overall Comparison and Risks for 2026
Similarities create near-term volatility risks: energy shocks, inflation repricing, and potential Fed tightening bias could pressure multiples, especially if oil remains elevated. Liquidity dynamics (though different sources) again favor concentrated tech exposure. Differences suggest a distinct bear-market character if one develops:
- 2022 was a sharp valuation compression in a fundamentally healthy economy—quick collapse followed by rapid rebound as inflation crested and growth resumed.
- 2026 confronts more structural issues: heavy reliance on AI earnings momentum (vulnerable if capex slows or ROI disappoints), softening labor, cautious consumers, and potential for slower growth amid higher energy costs. Valuations, while not as extreme as 2022 peaks, remain elevated in key growth segments.
If earnings growth (the primary 2023–2025 driver) falters—e.g., NVDA or broader Mag7 missing on AI monetization—prices could decline further even at seemingly “attractive” 20–25x forward P/Es. A “bubble deflation” scenario (gradual earnings slowdown and multiple contraction) appears more plausible than 2022’s abrupt burst. Recovery may be slower without the post-2022 tailwinds of peaking inflation and policy easing. Broader U.S. economic vulnerabilities (debt levels, productivity questions beyond AI hype, geopolitical fragmentation) reduce the likelihood of a swift rebound.
Investment Implications and Navigation Strategies
- Risk Management: Expect heightened volatility in energy, inflation-sensitive assets, and growth stocks. Diversify beyond Mag7 concentration; monitor quarterly earnings for AI capex sustainability and margin trends.
- Opportunities: Energy sector as a hedge against oil shocks; value or defensive names if growth slows; selective AI infrastructure plays with proven earnings delivery. International exposure may benefit if U.S. growth lags.
- Policy Watch: Track Fed communications closely—any shift toward hikes could accelerate downside, while growth concerns might prompt cuts. Oil price trajectory (Hormuz reopening, alternative routes) will be pivotal for inflation and sentiment.
- Scenario Planning: Base case—mild slowdown with contained inflation if conflict de-escalates quickly. Bear case—prolonged energy disruption, earnings misses, and stagflation-like pressures leading to drawn-out market stagnation. Bull case—quick resolution, AI productivity proving real, and soft landing.
Position portfolios defensively on valuations while retaining exposure to secular themes like AI, but demand evidence of earnings resilience over narrative momentum. History rhymes, but 2026’s unique mix of supply shocks and underlying fragility calls for caution over complacency.
Recommended Articles